


Sara SCANs
Sara SCANs (Strategic Capital Allocation Notes) turn complex markets into clear, data-driven playbooks with forecasts, risks, and ways to get price exposure.
The Future Money Index by Sara AI tracks the combined performance of Gold, Silver, and Bitcoin. It gives a snapshot of hard-money strength. Base date: 16 Sept 2025.
This graph maps the price movements of Gold, Silver & Bitcoin across various timeframes (1-hour to 90-days).
Sara AI's Predictive Intelligence delivers AI-driven forecasts and price outlooks across Commodities, Crypto, Forex, and Stock Indexes. List of factors that Sara AI analyzes to make predictions.
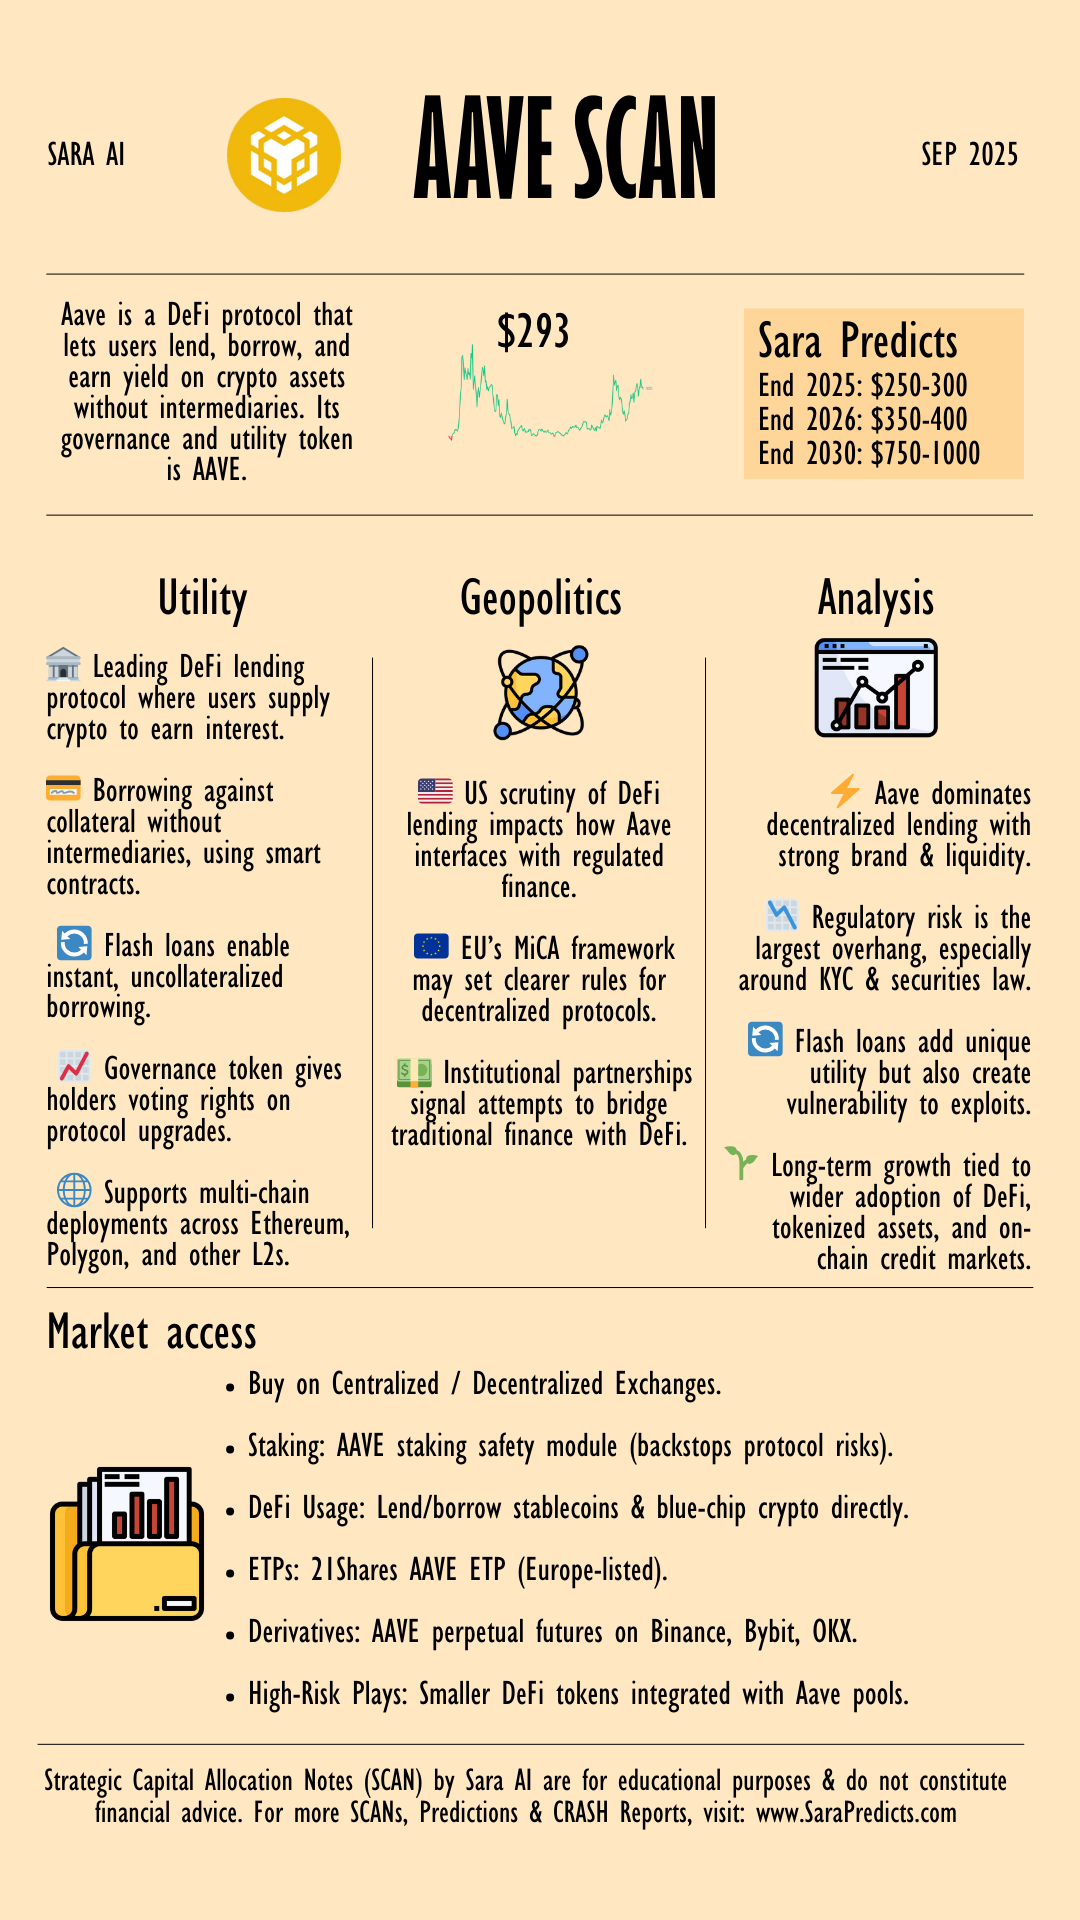
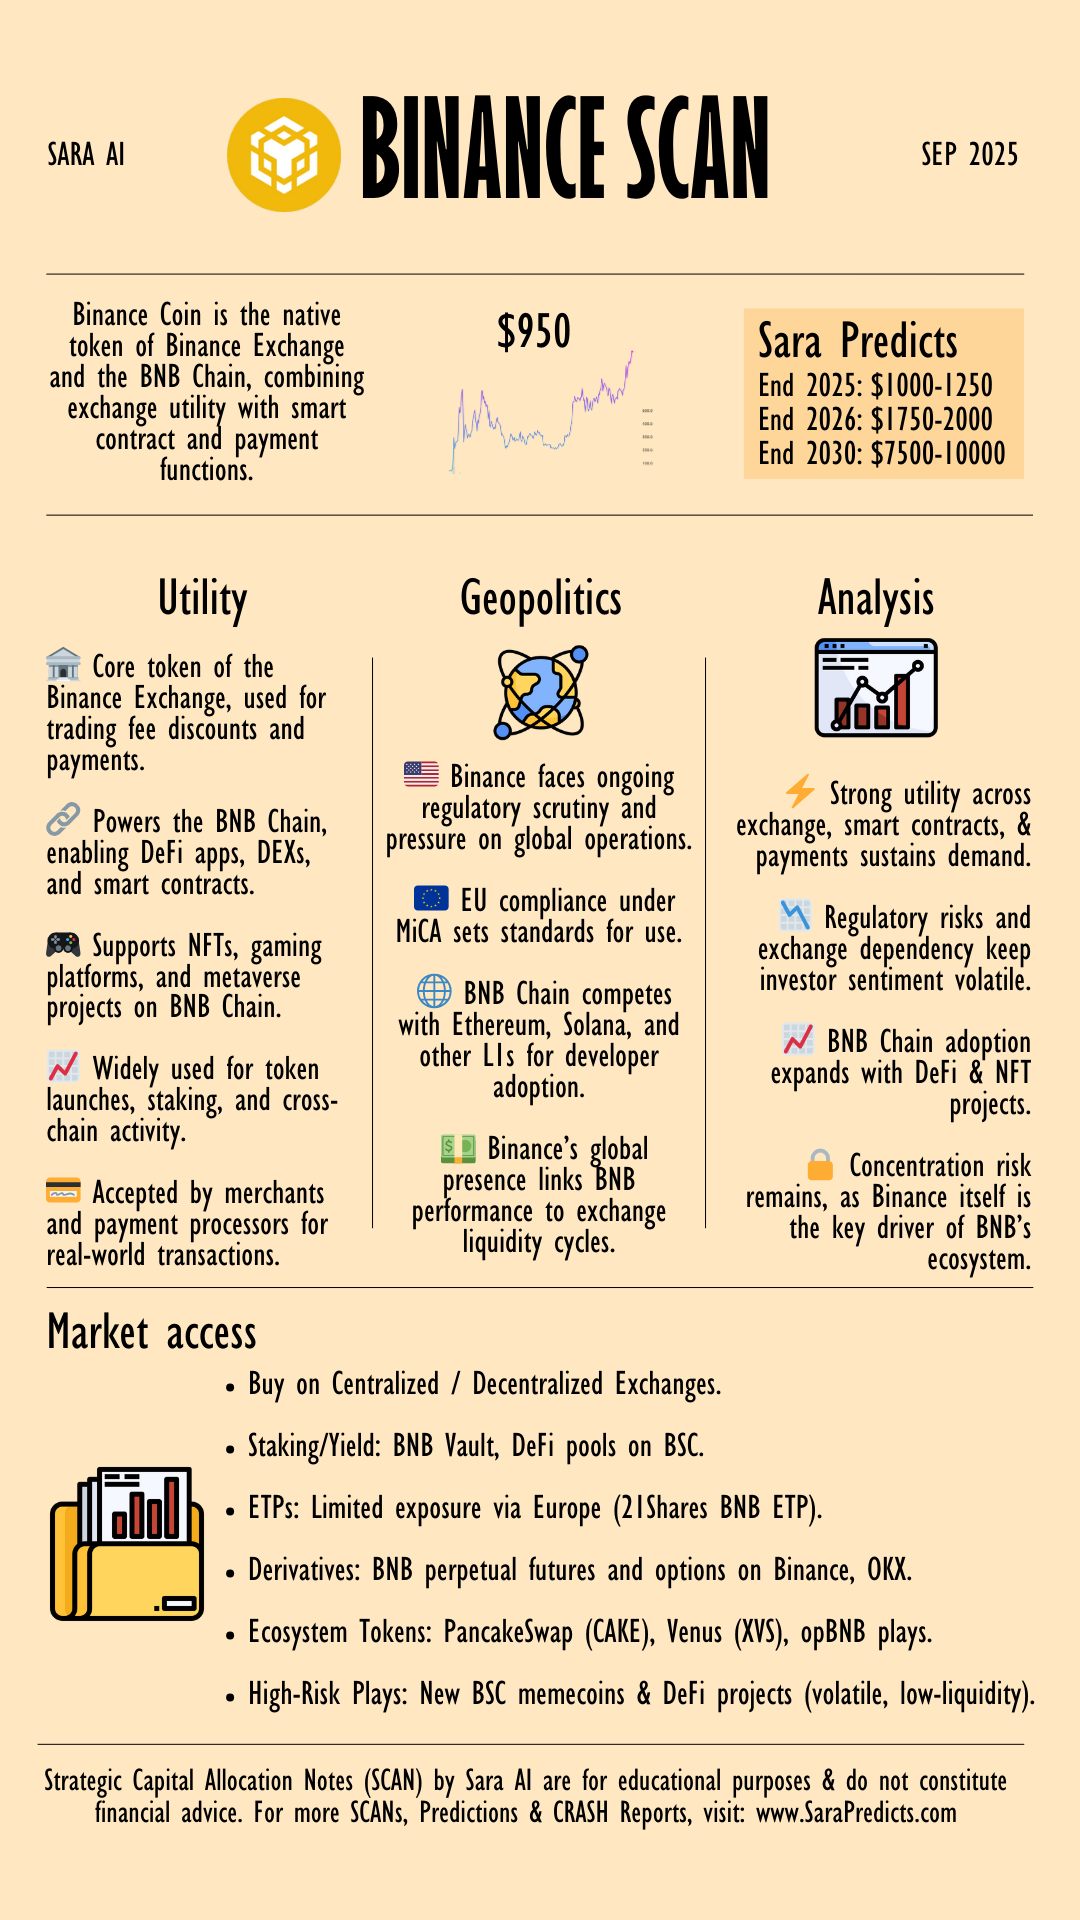
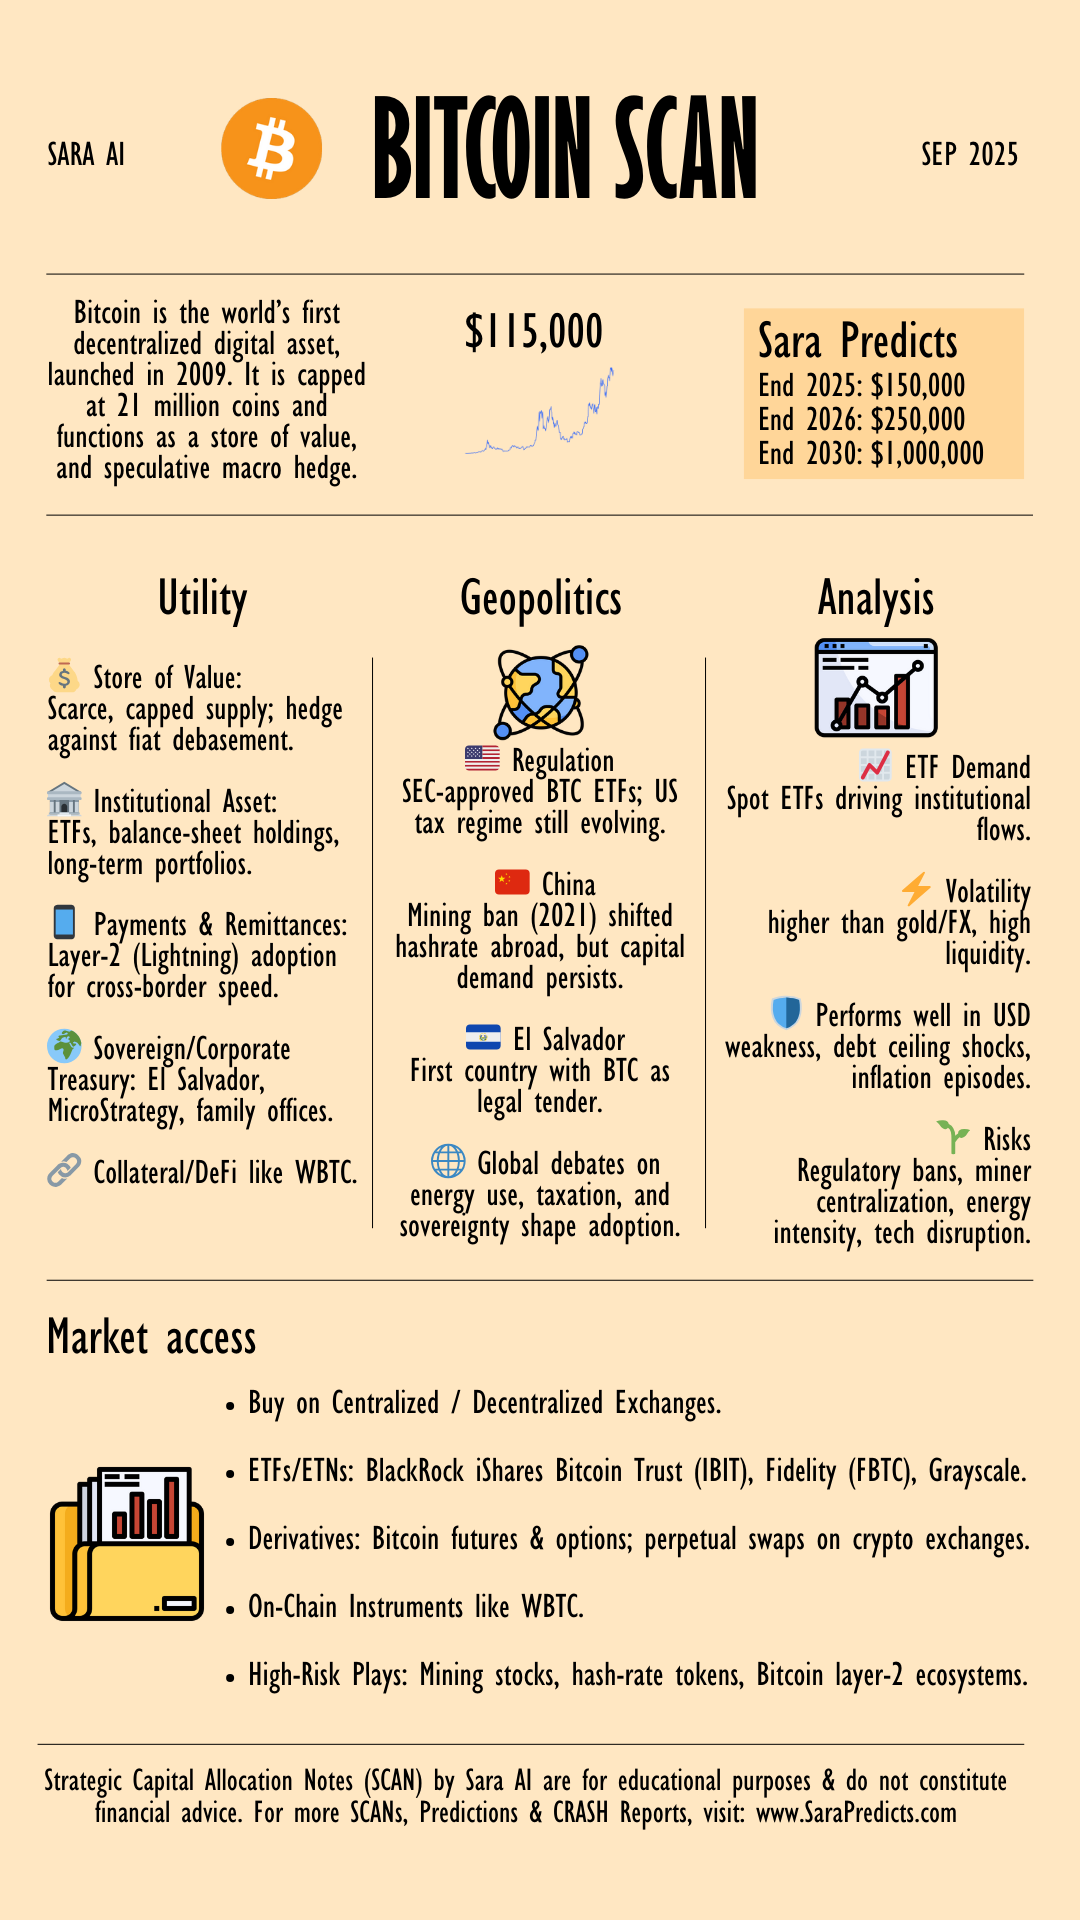
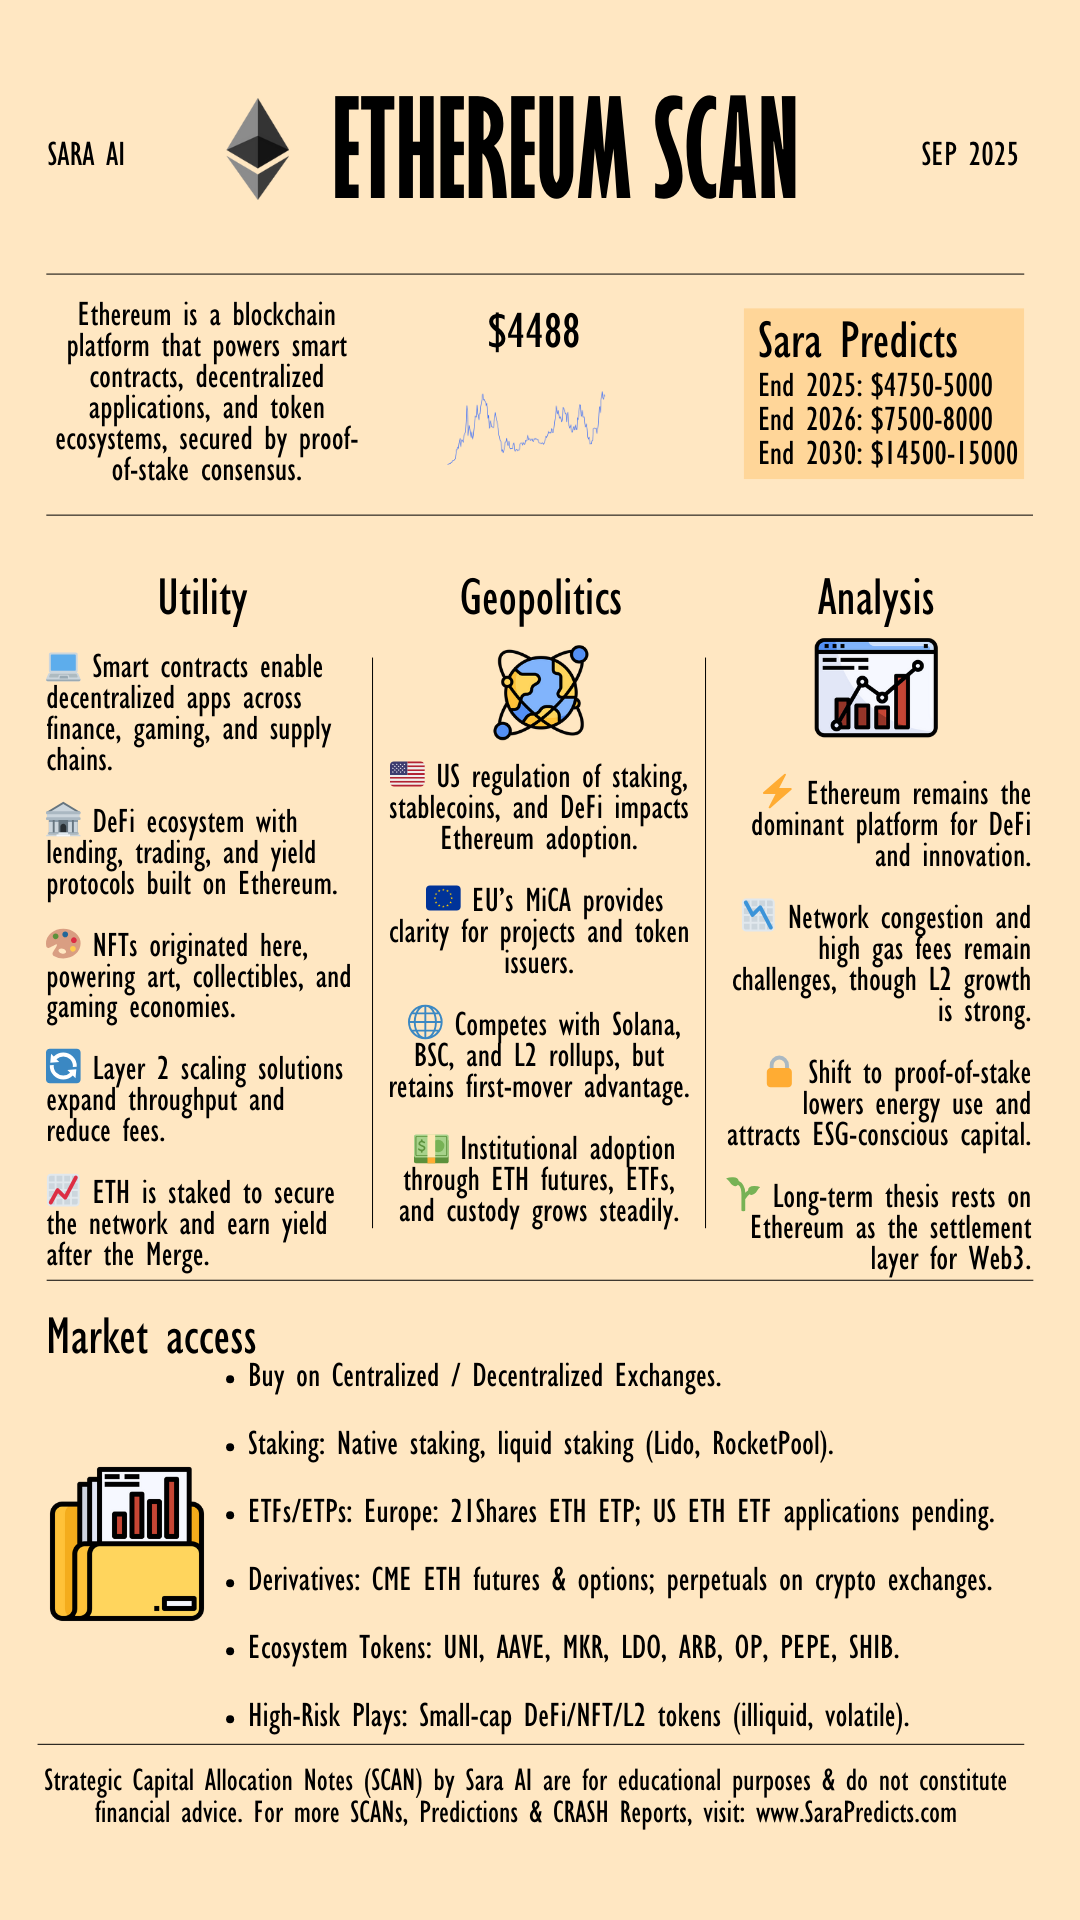
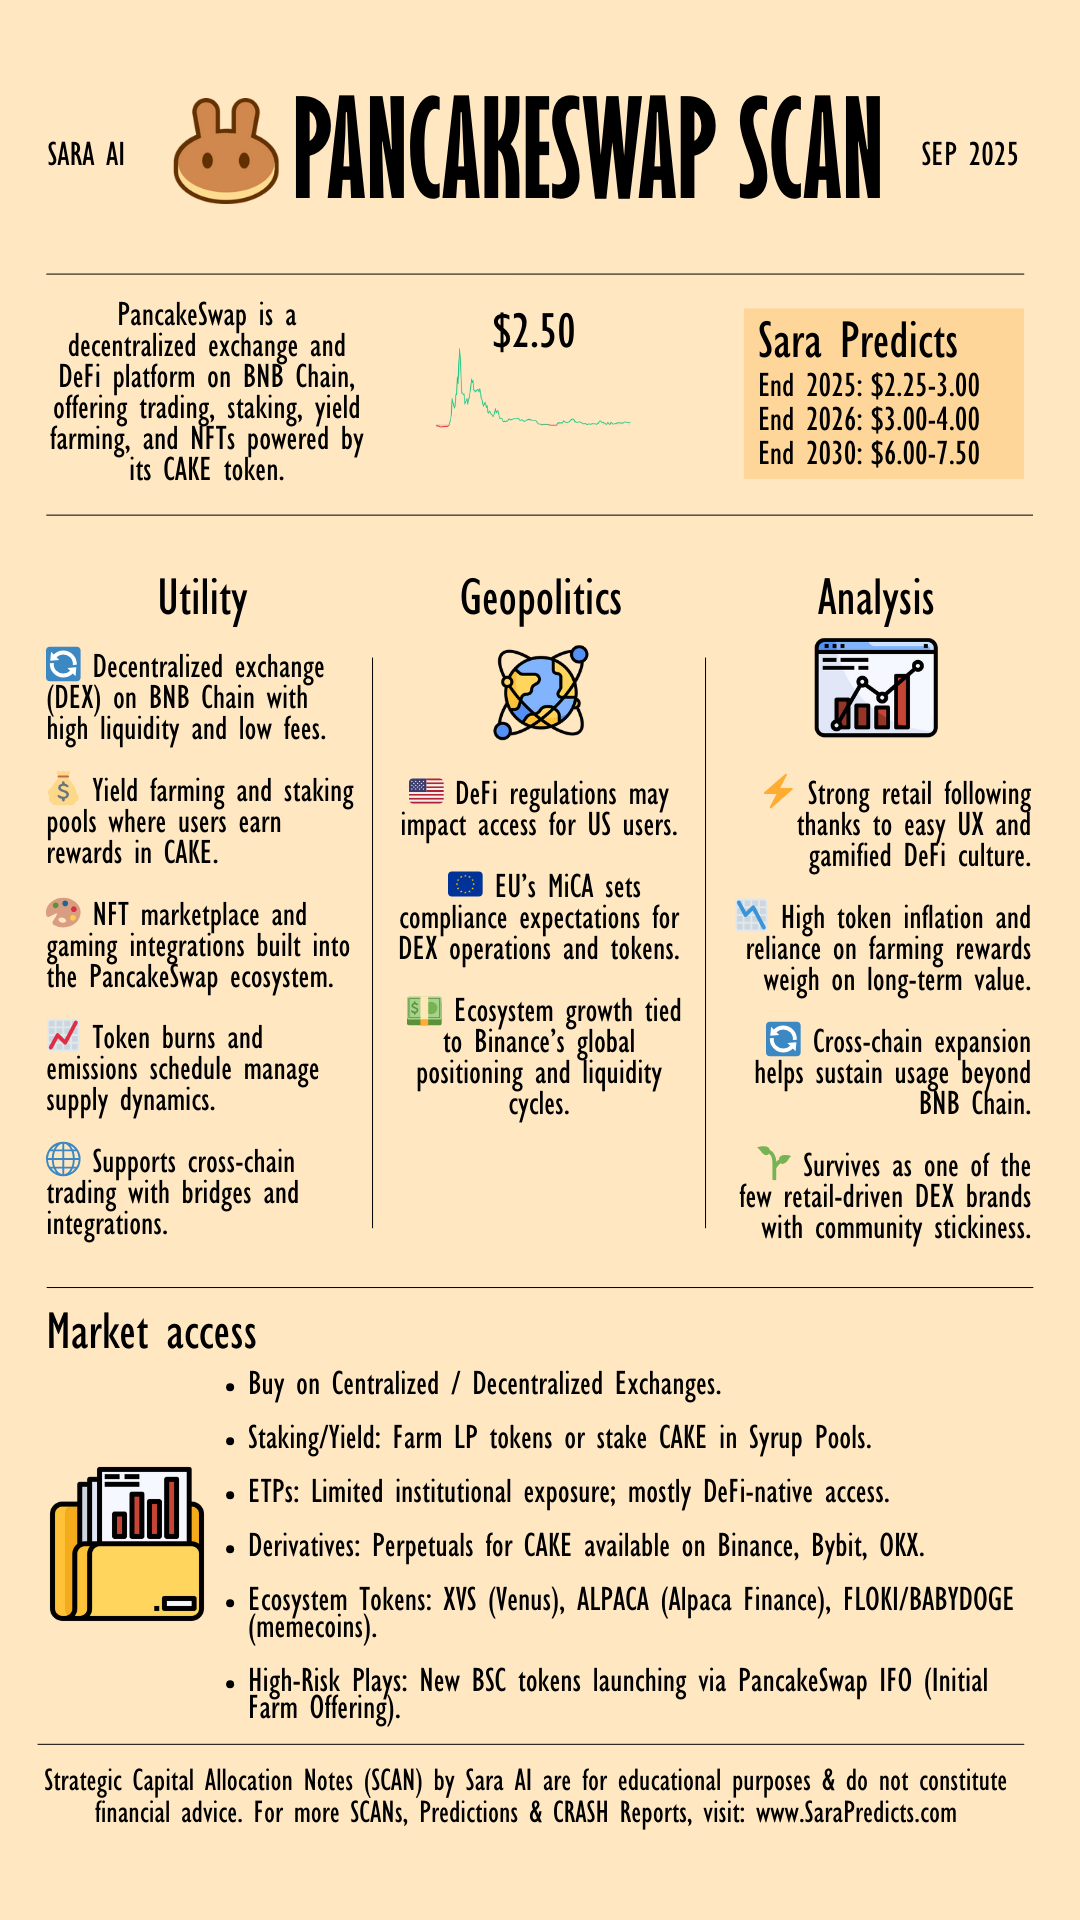
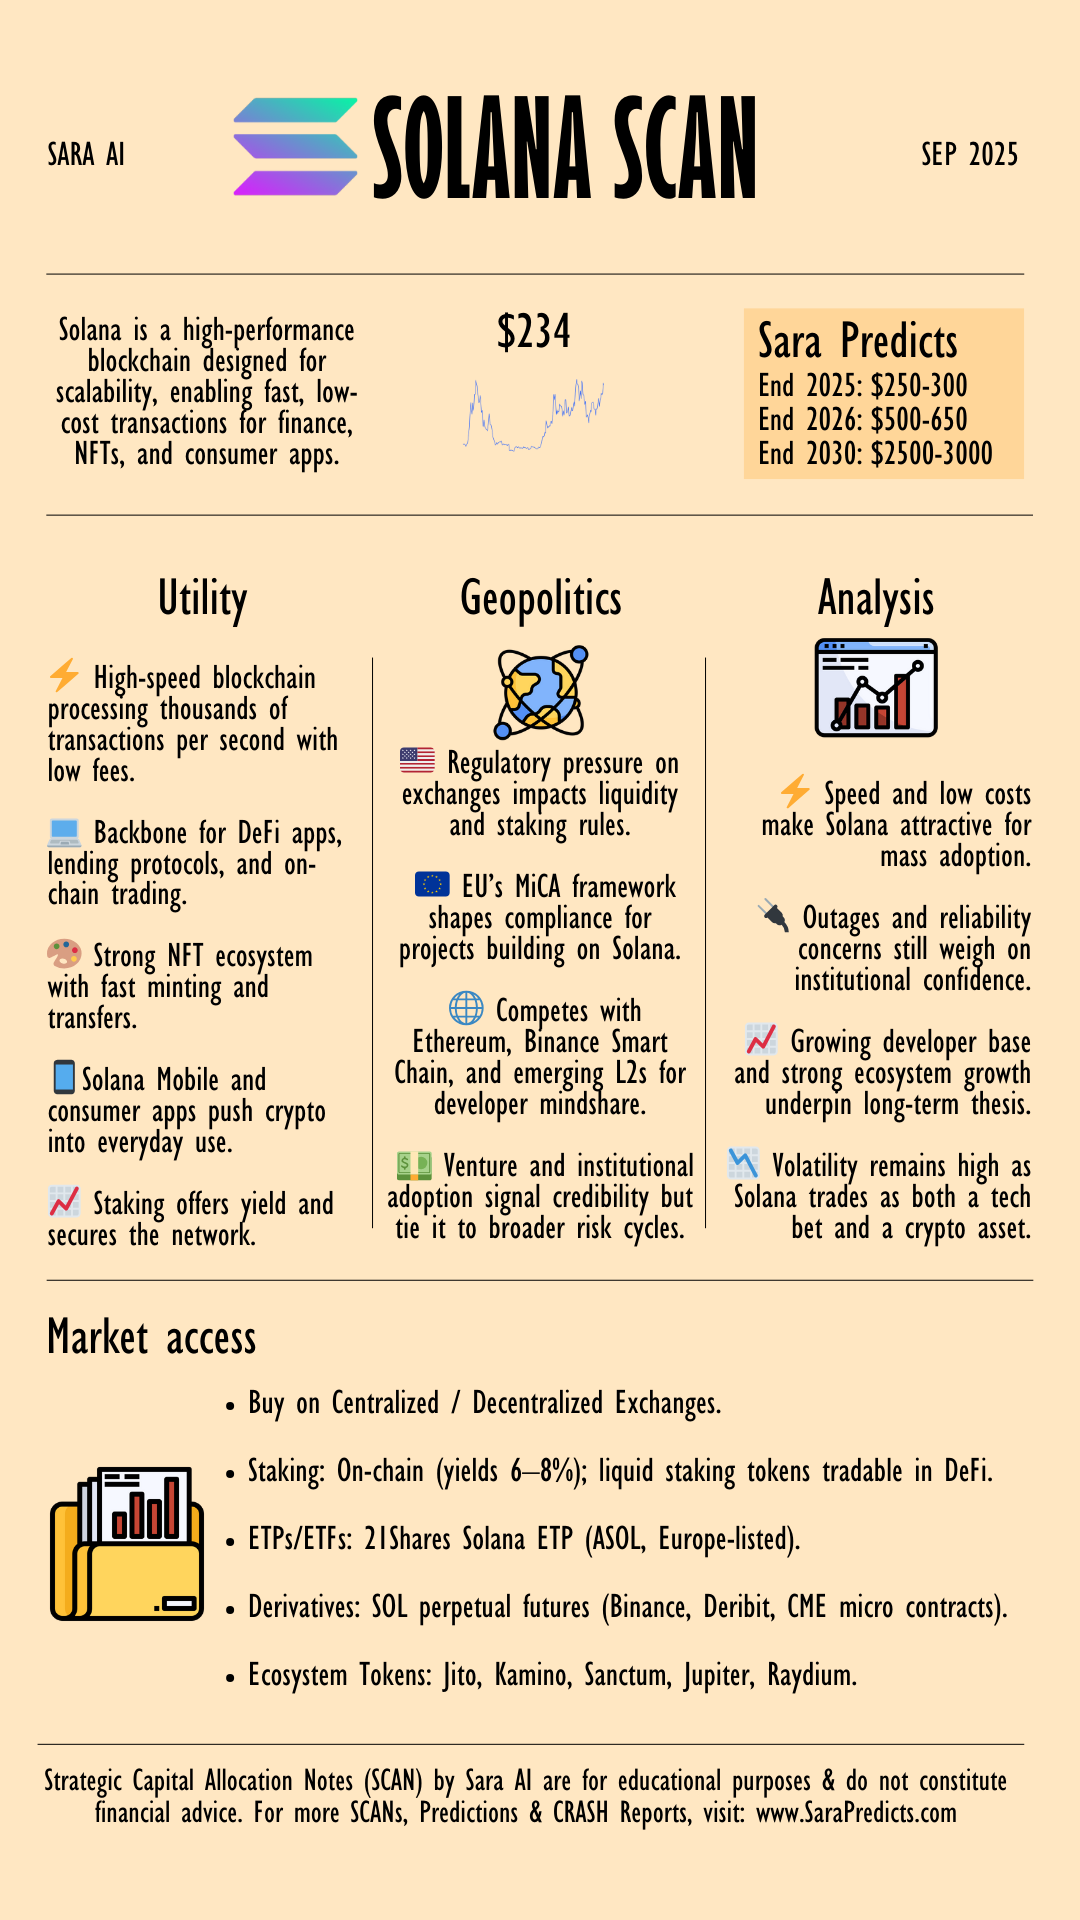
Click on a crypto below to access its Sara SCAN and forecast.
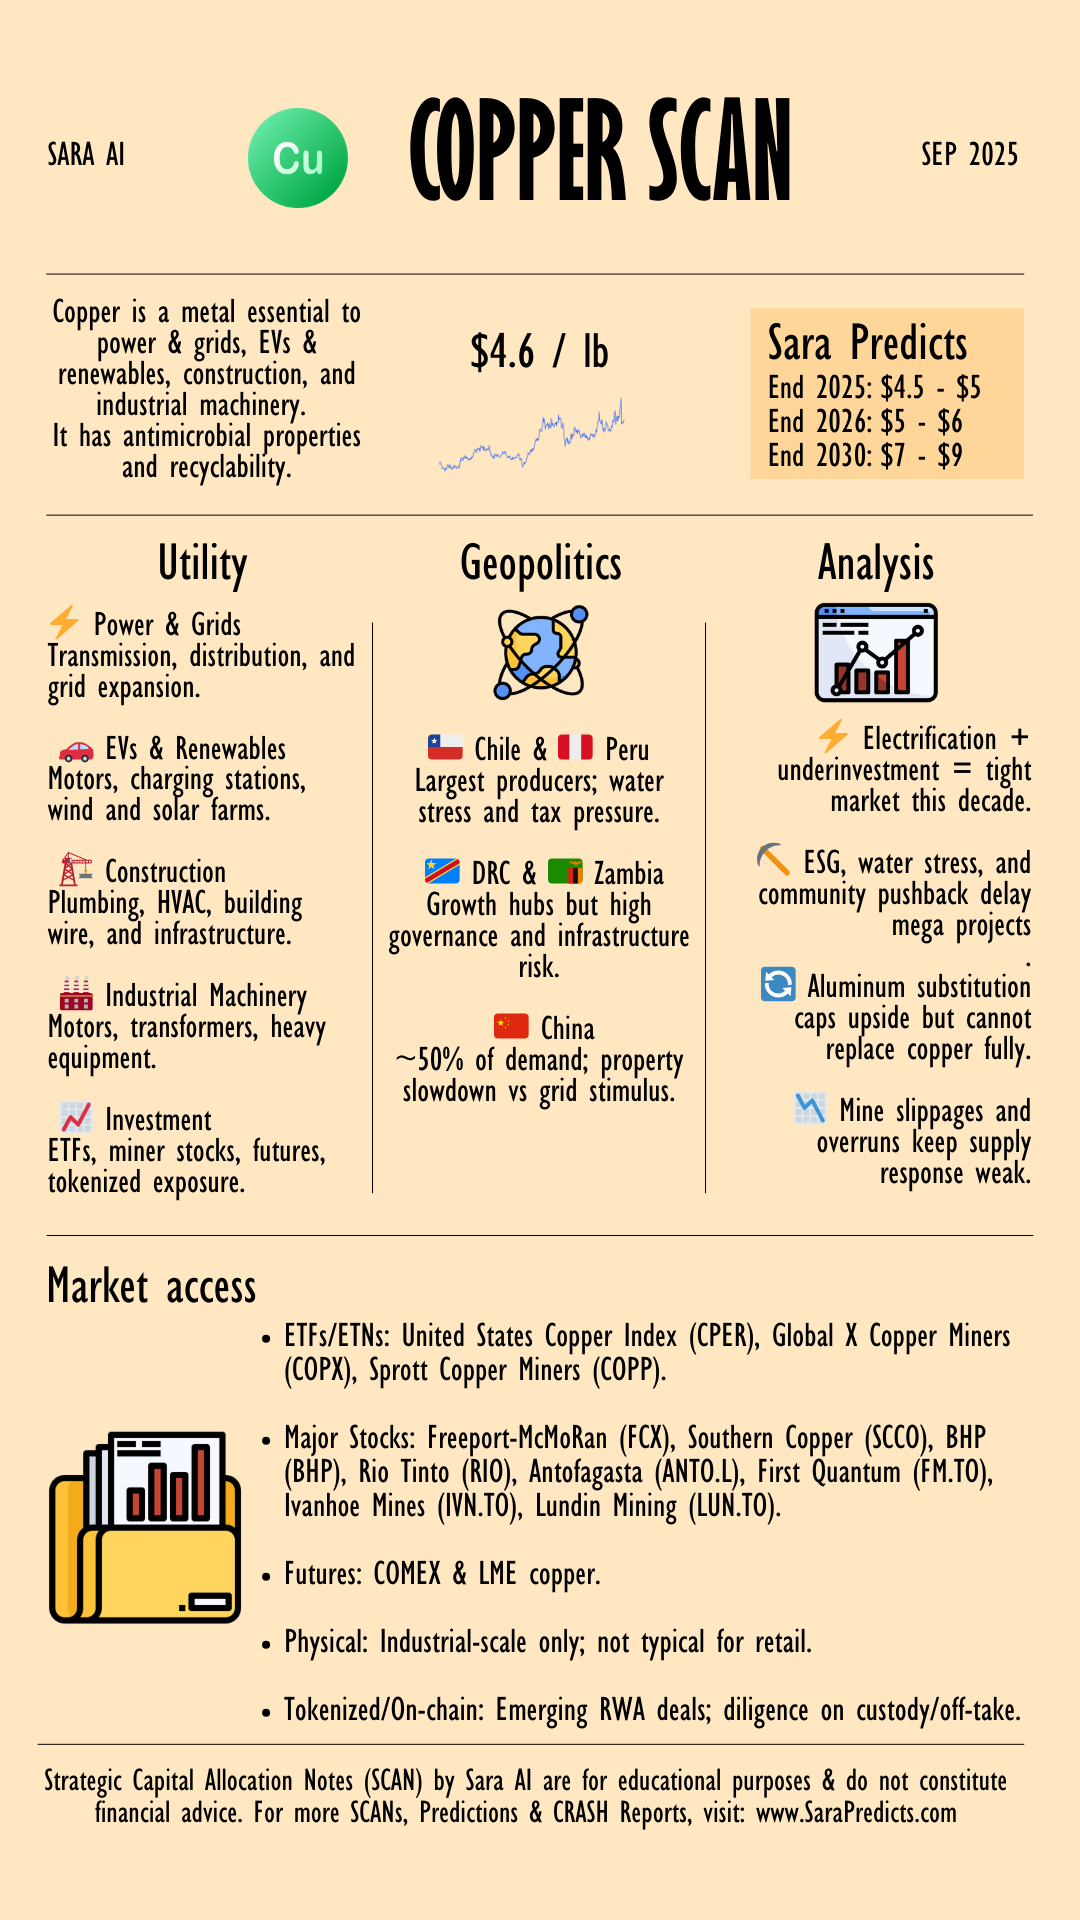
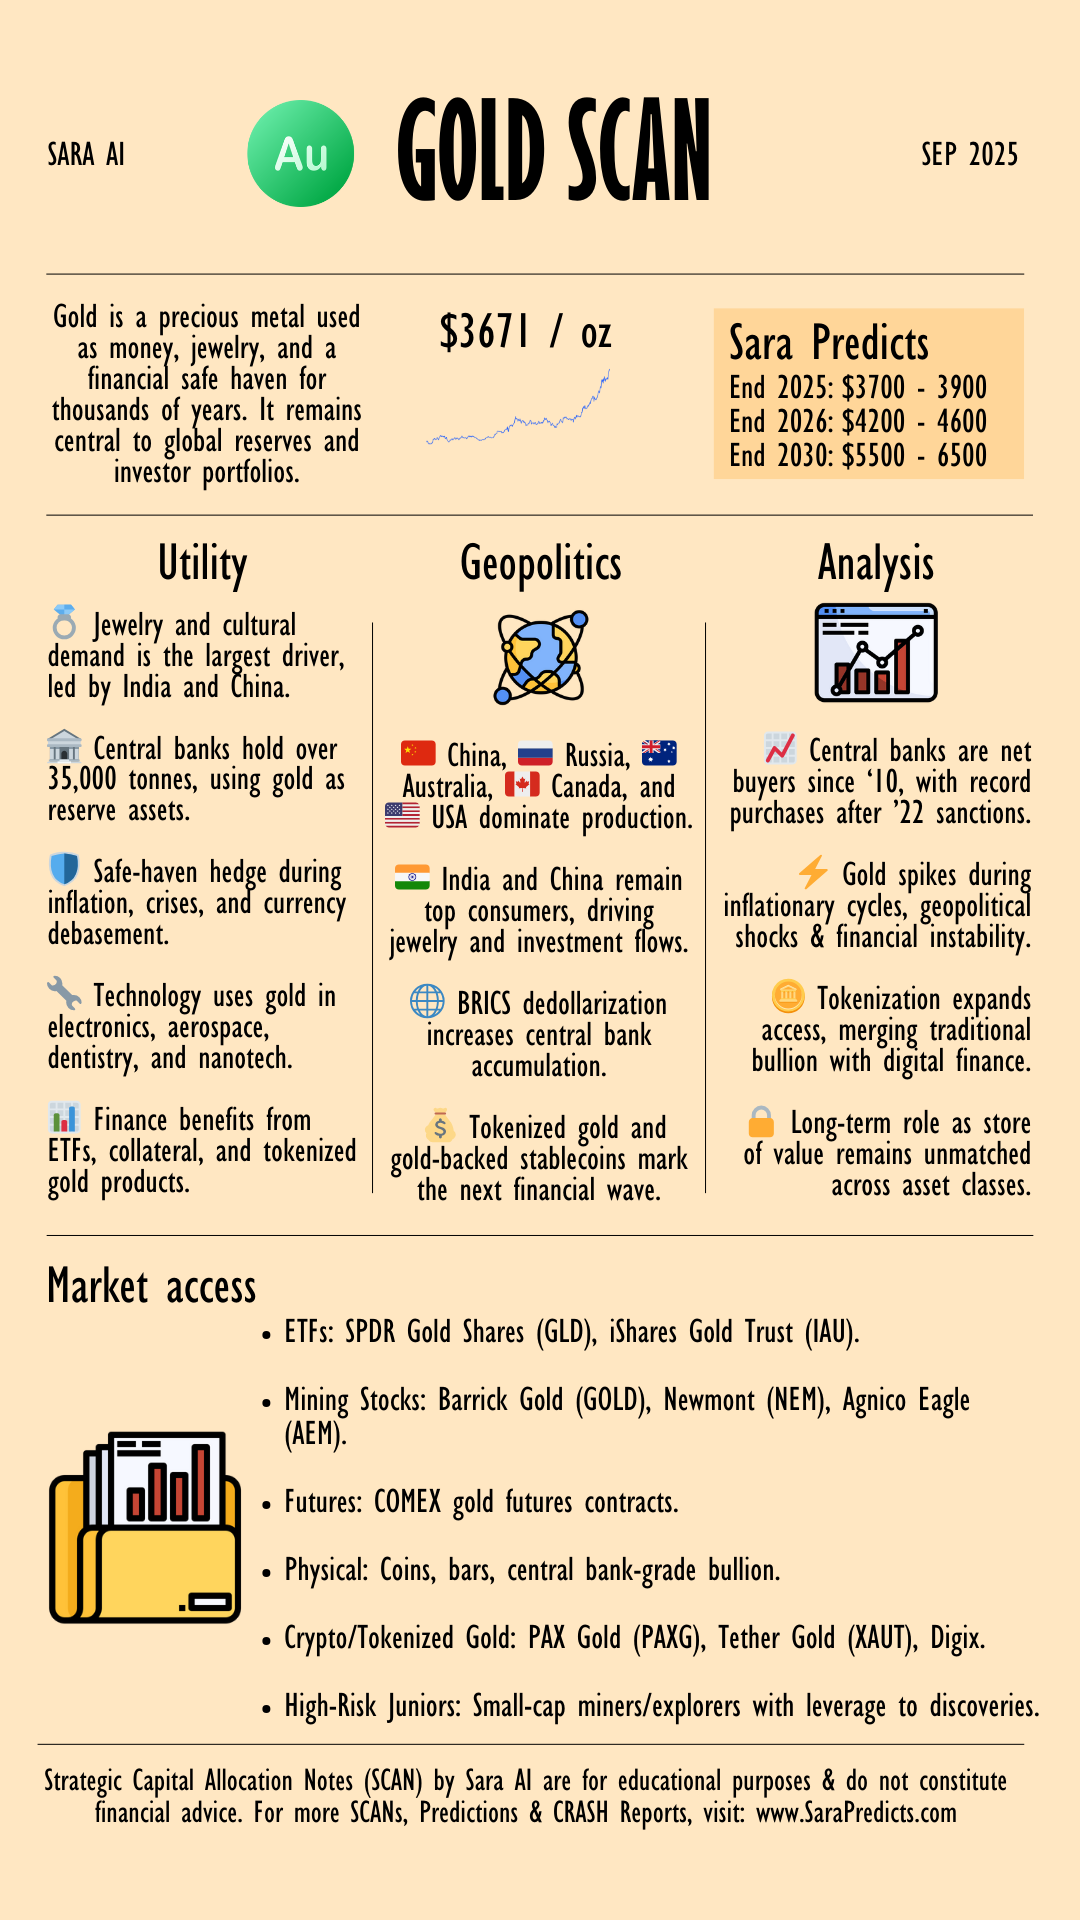
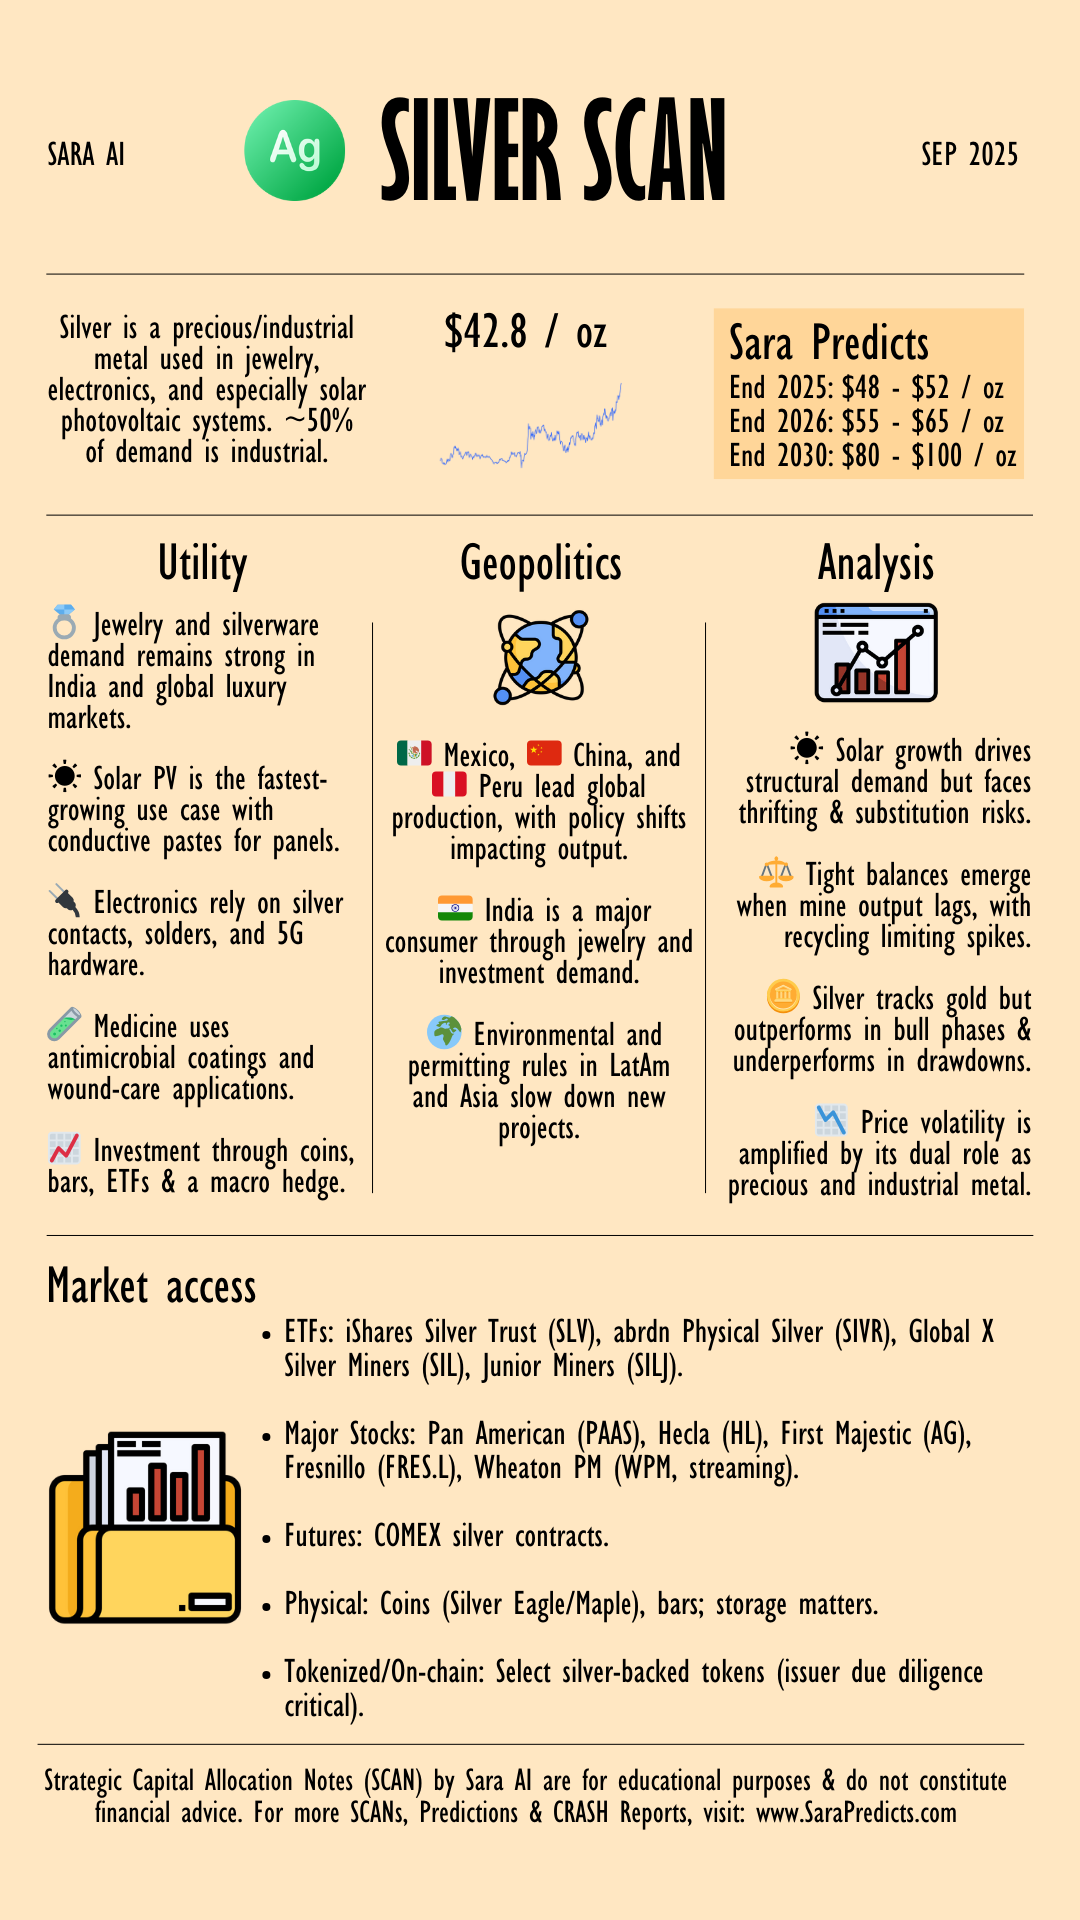
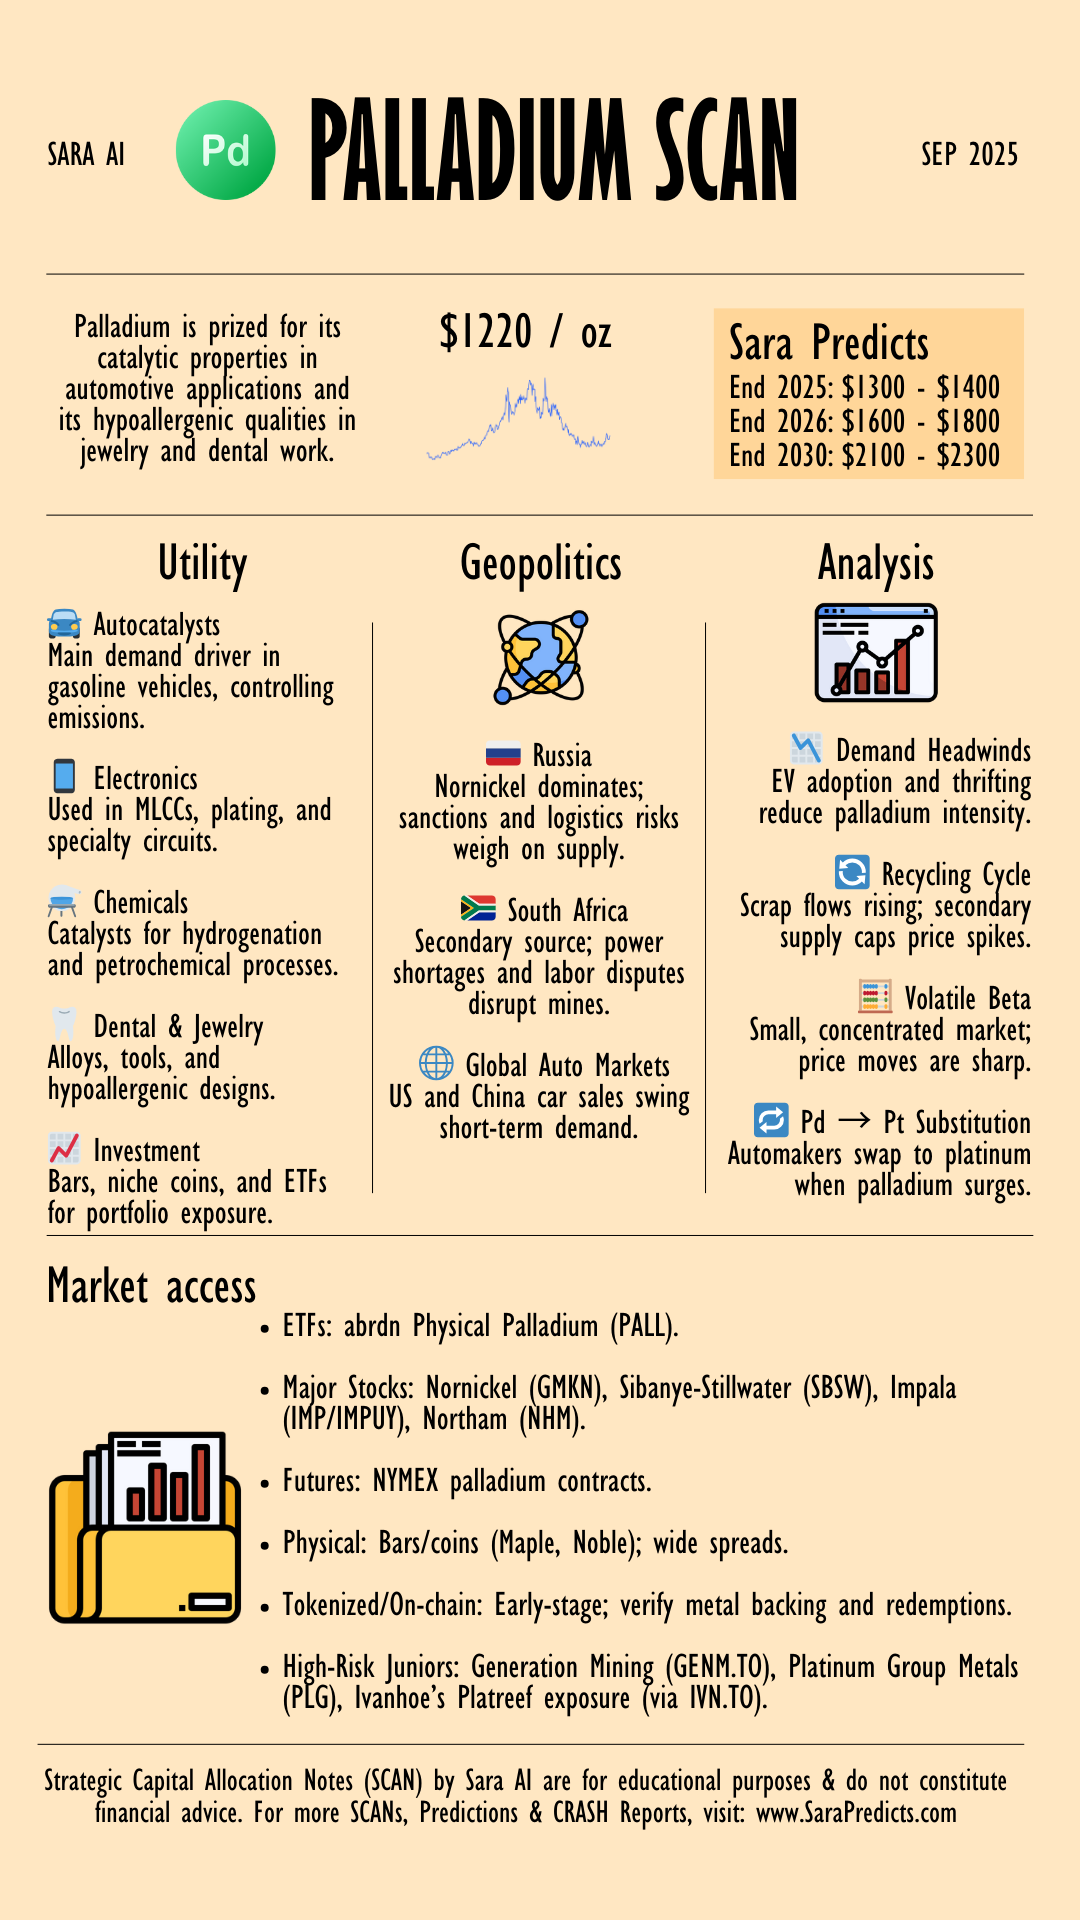
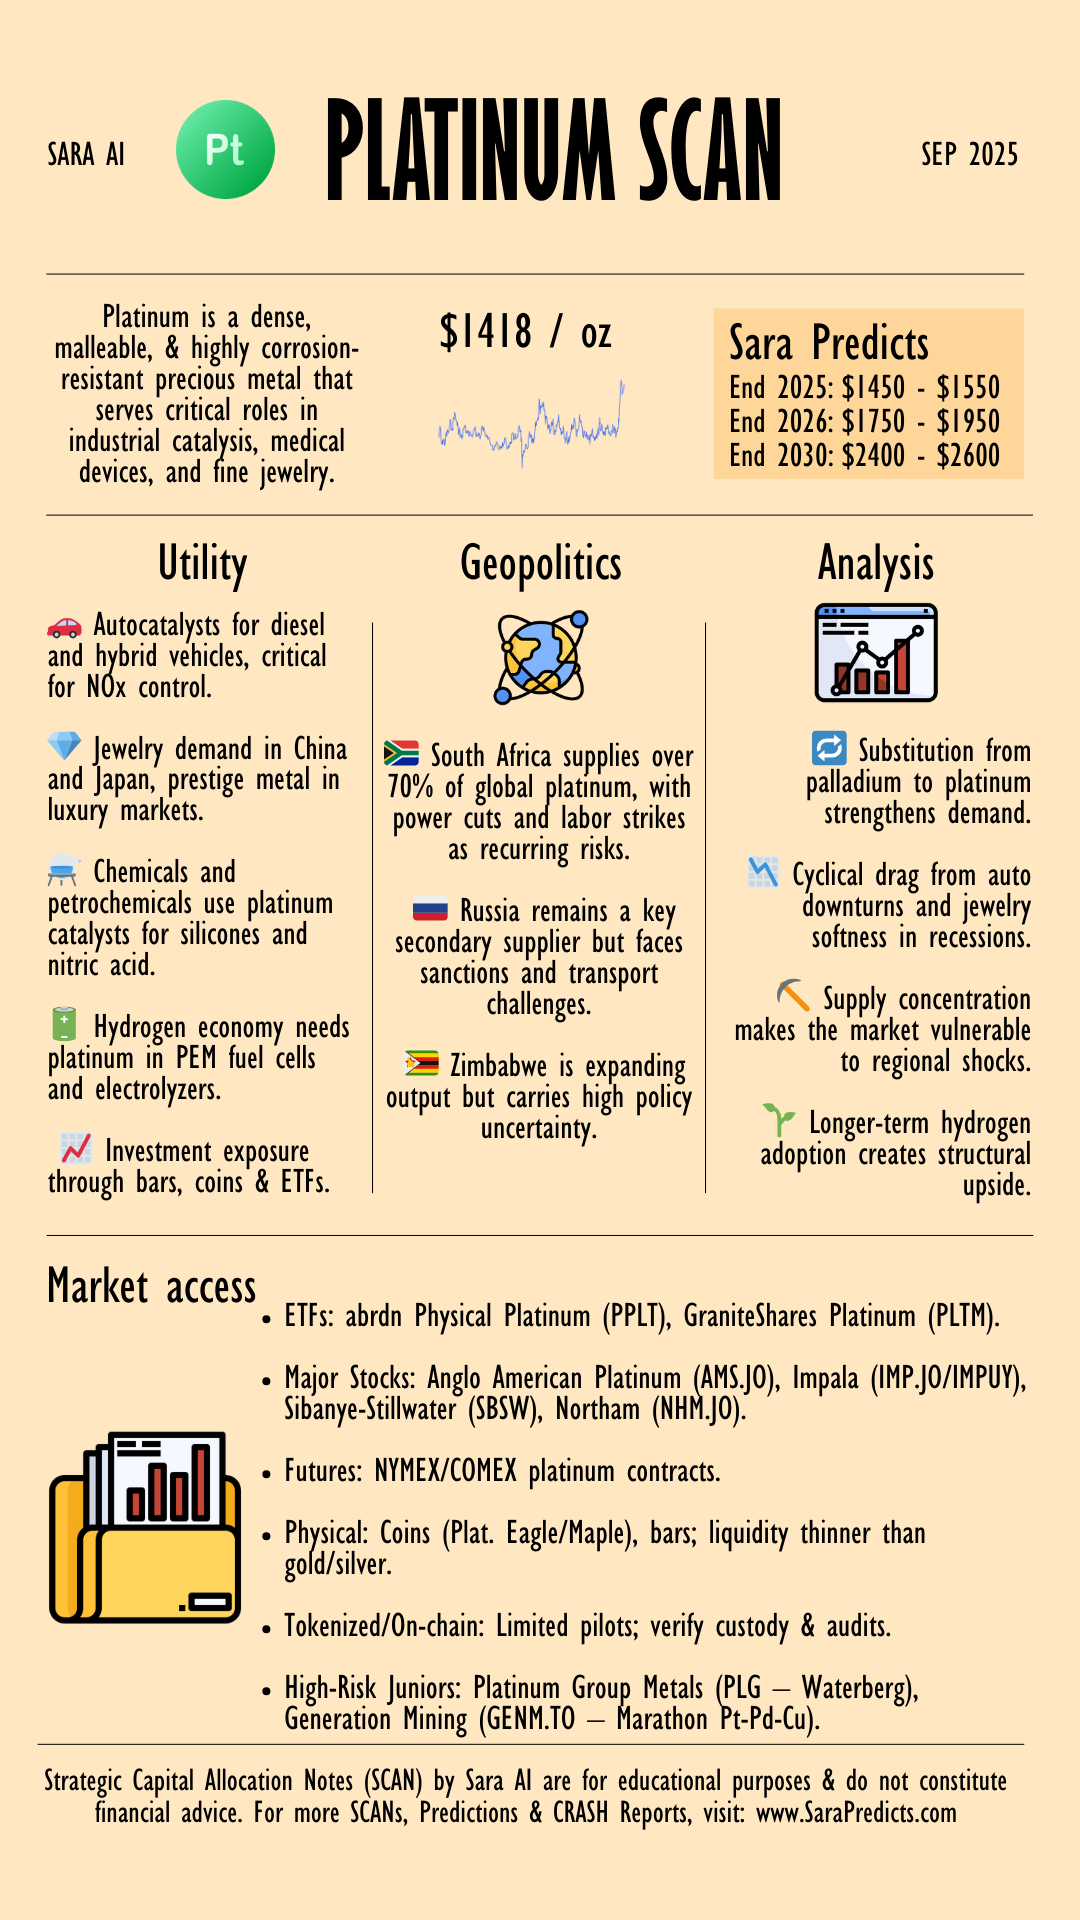
Click on a commodity below to access its Sara SCAN and forecast.
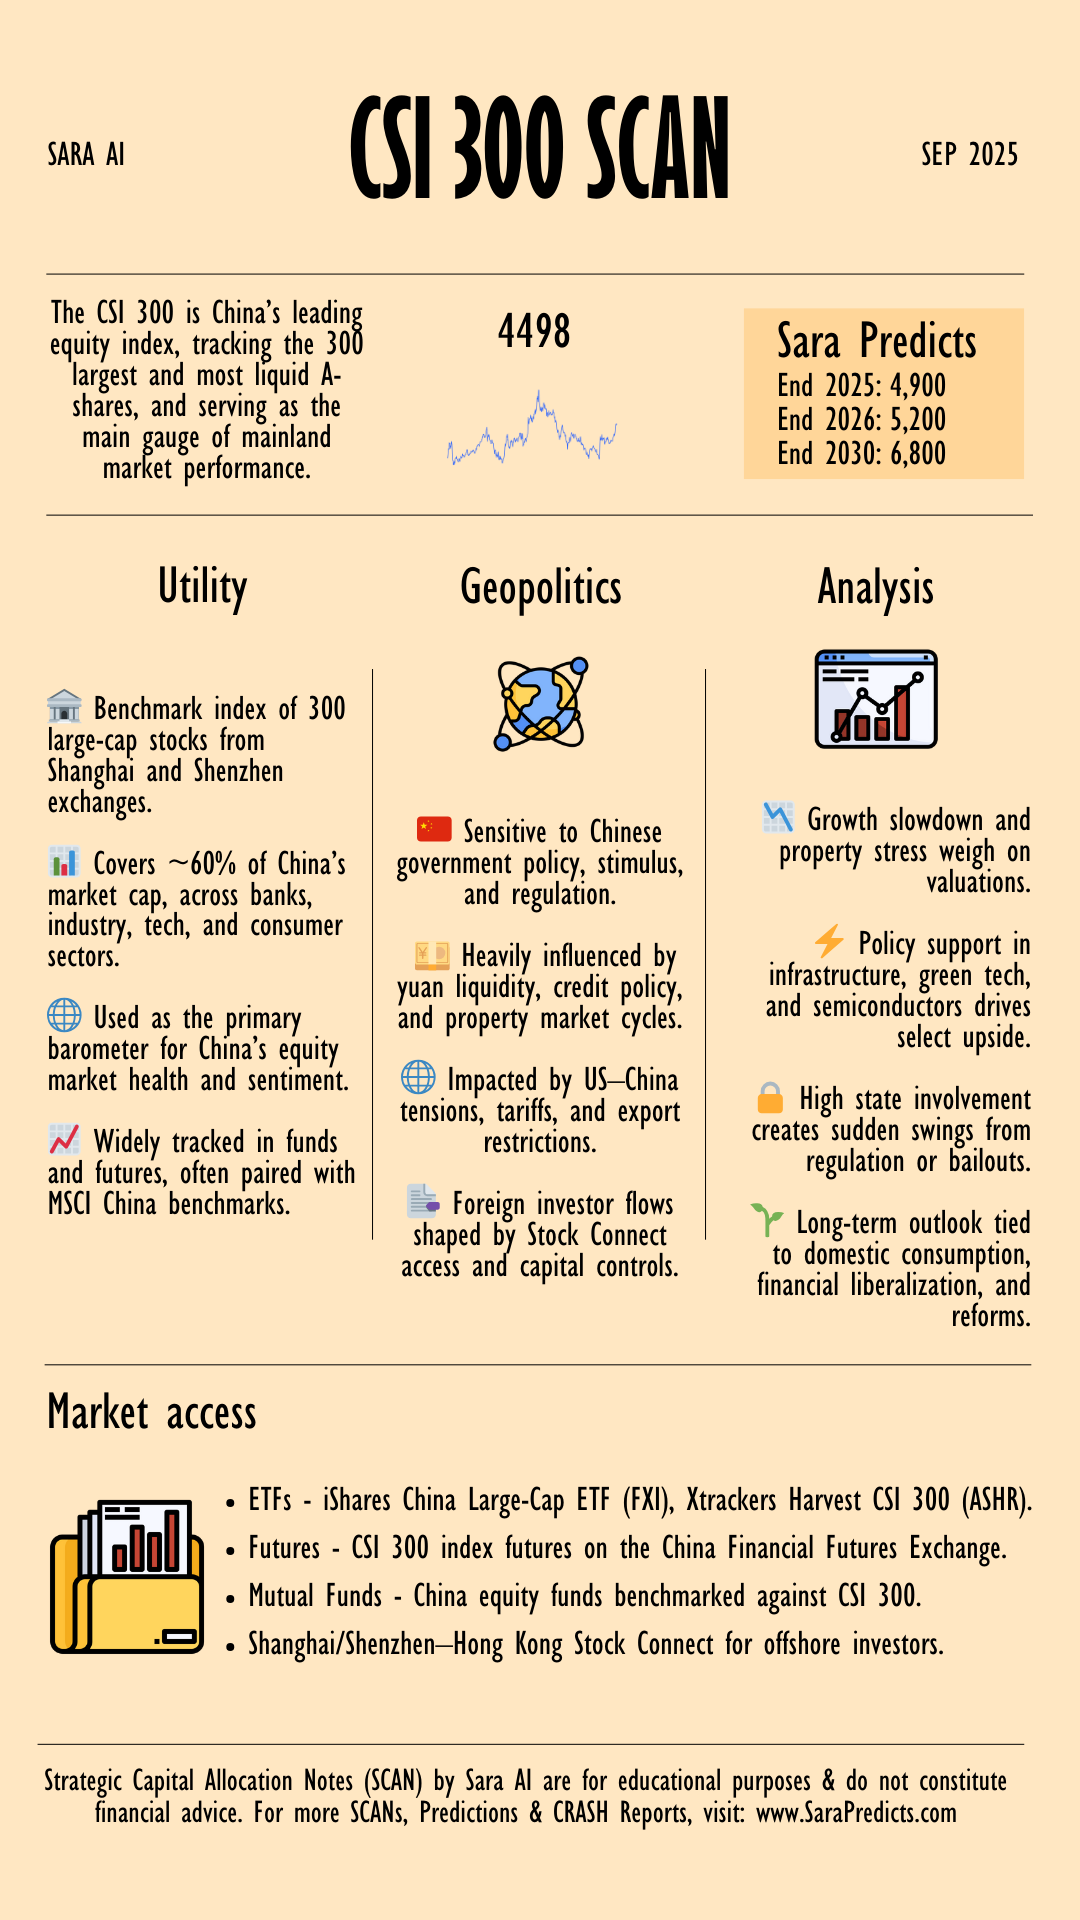
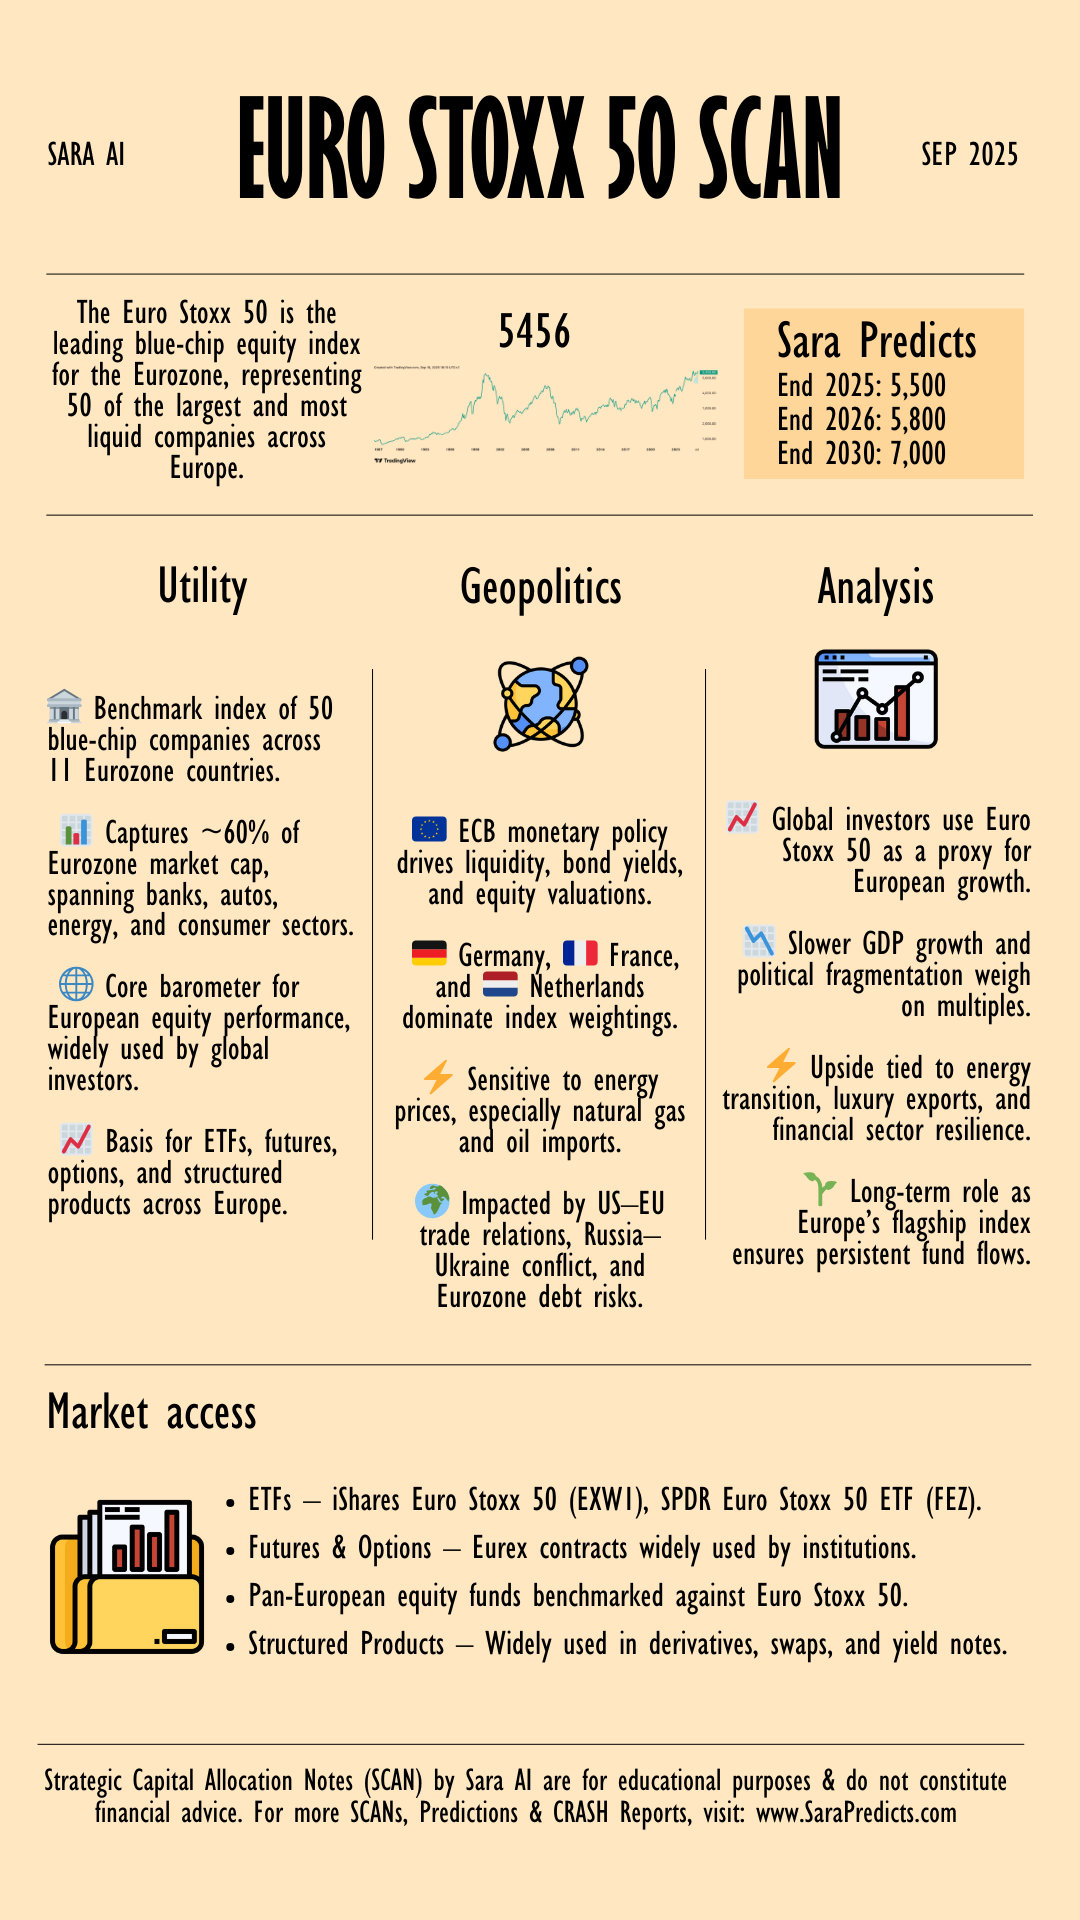
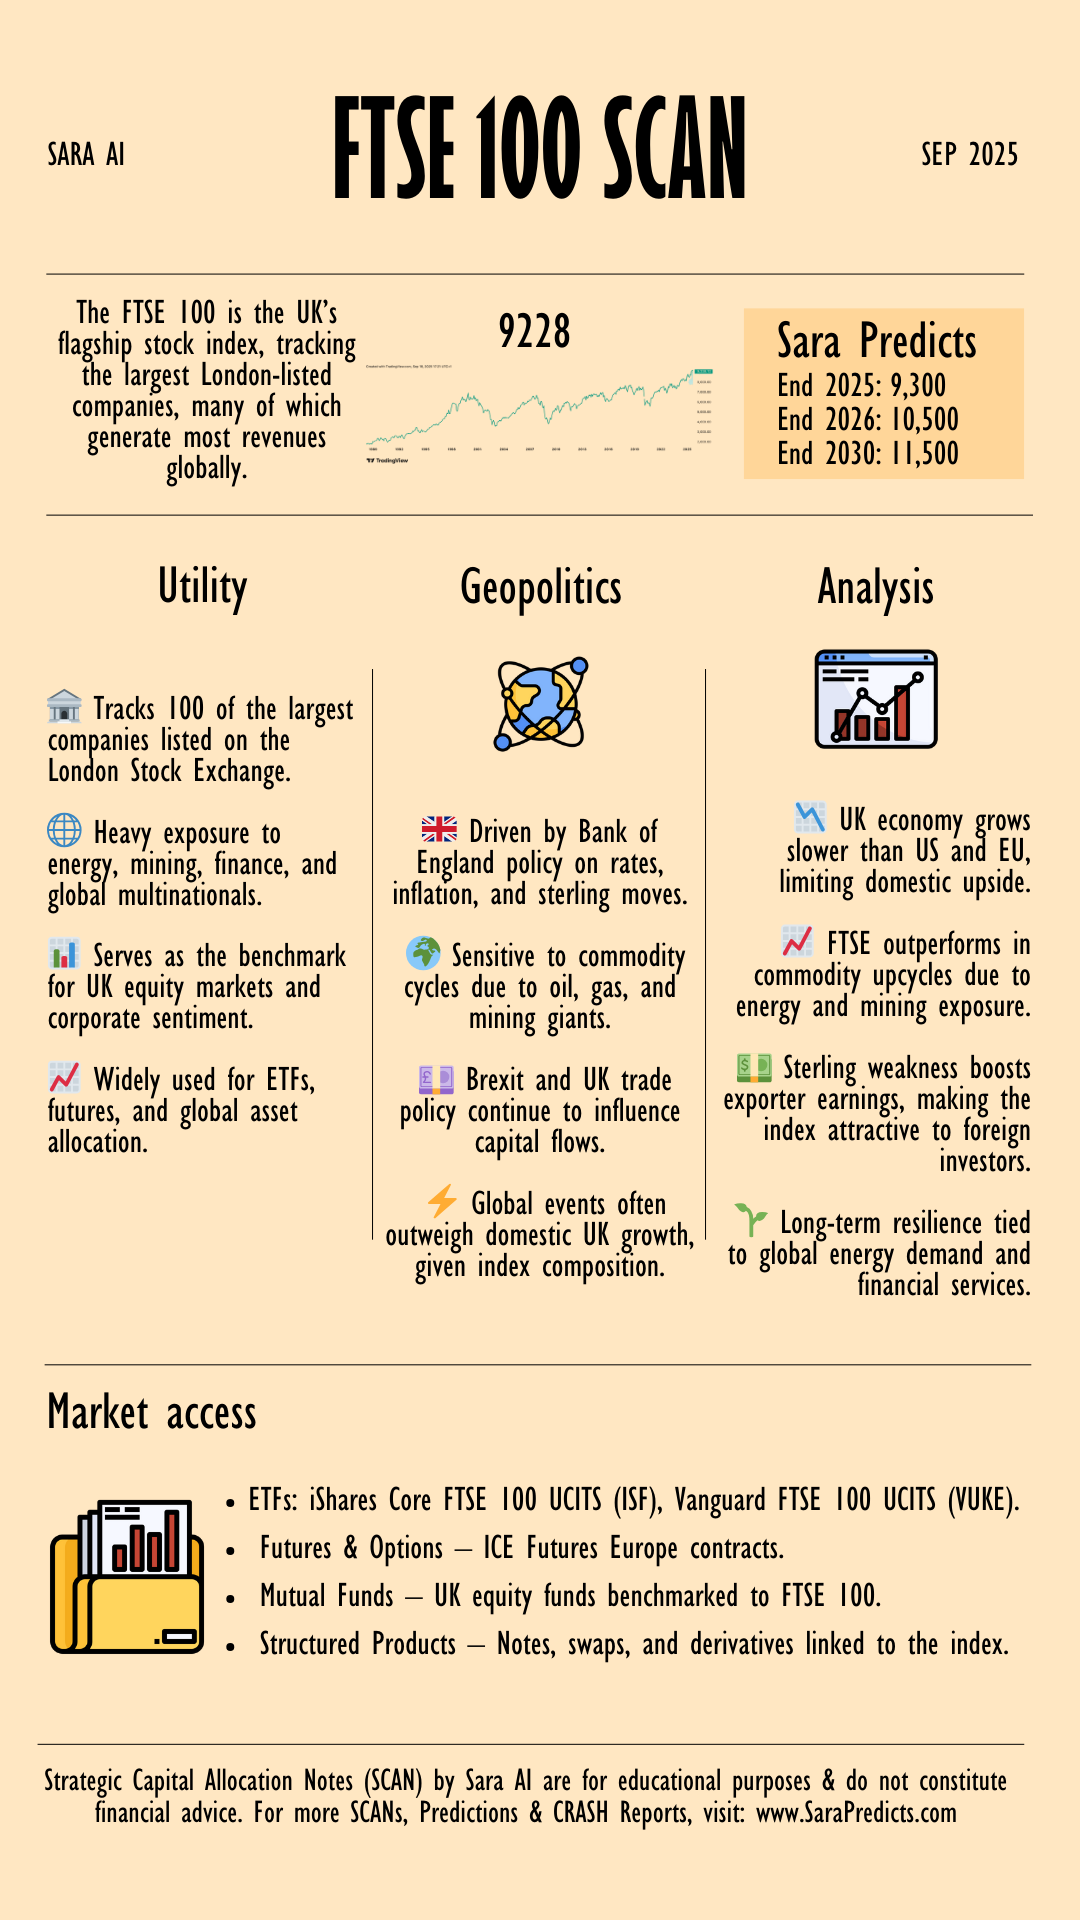
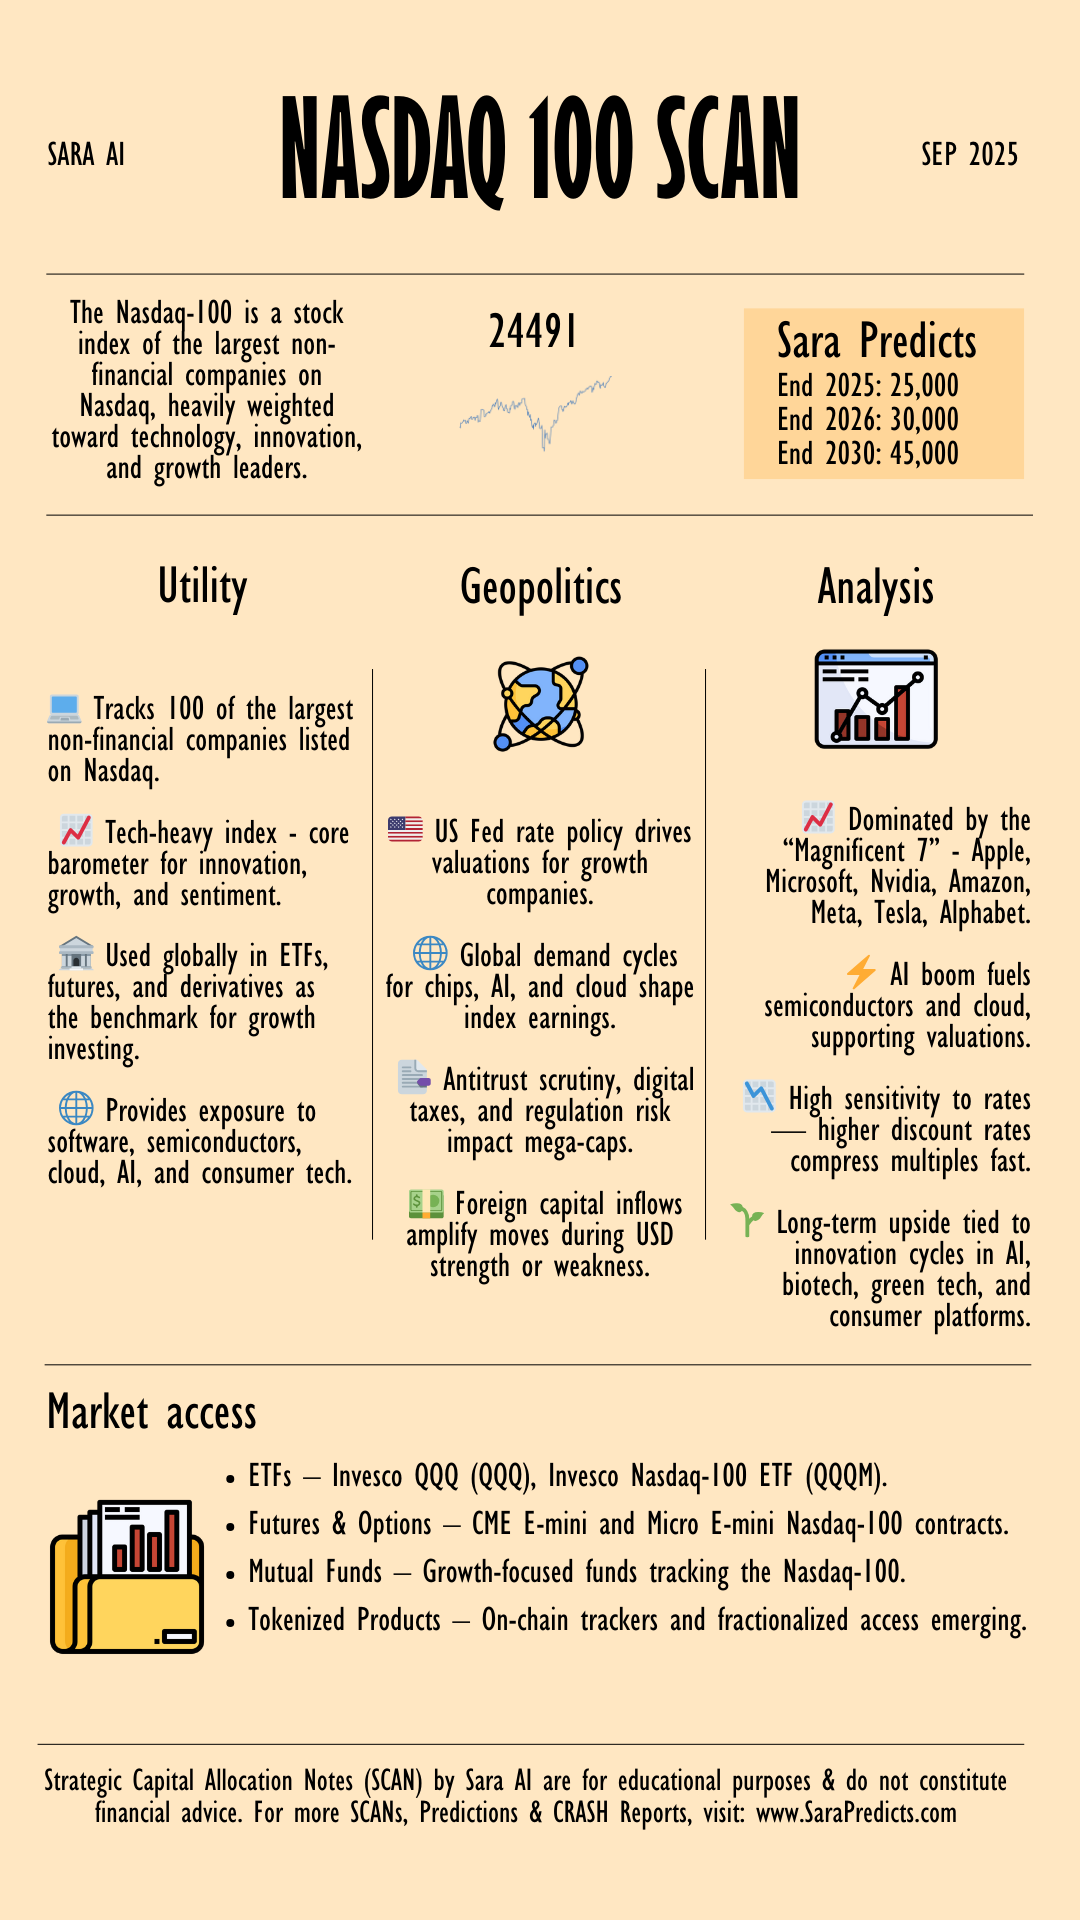
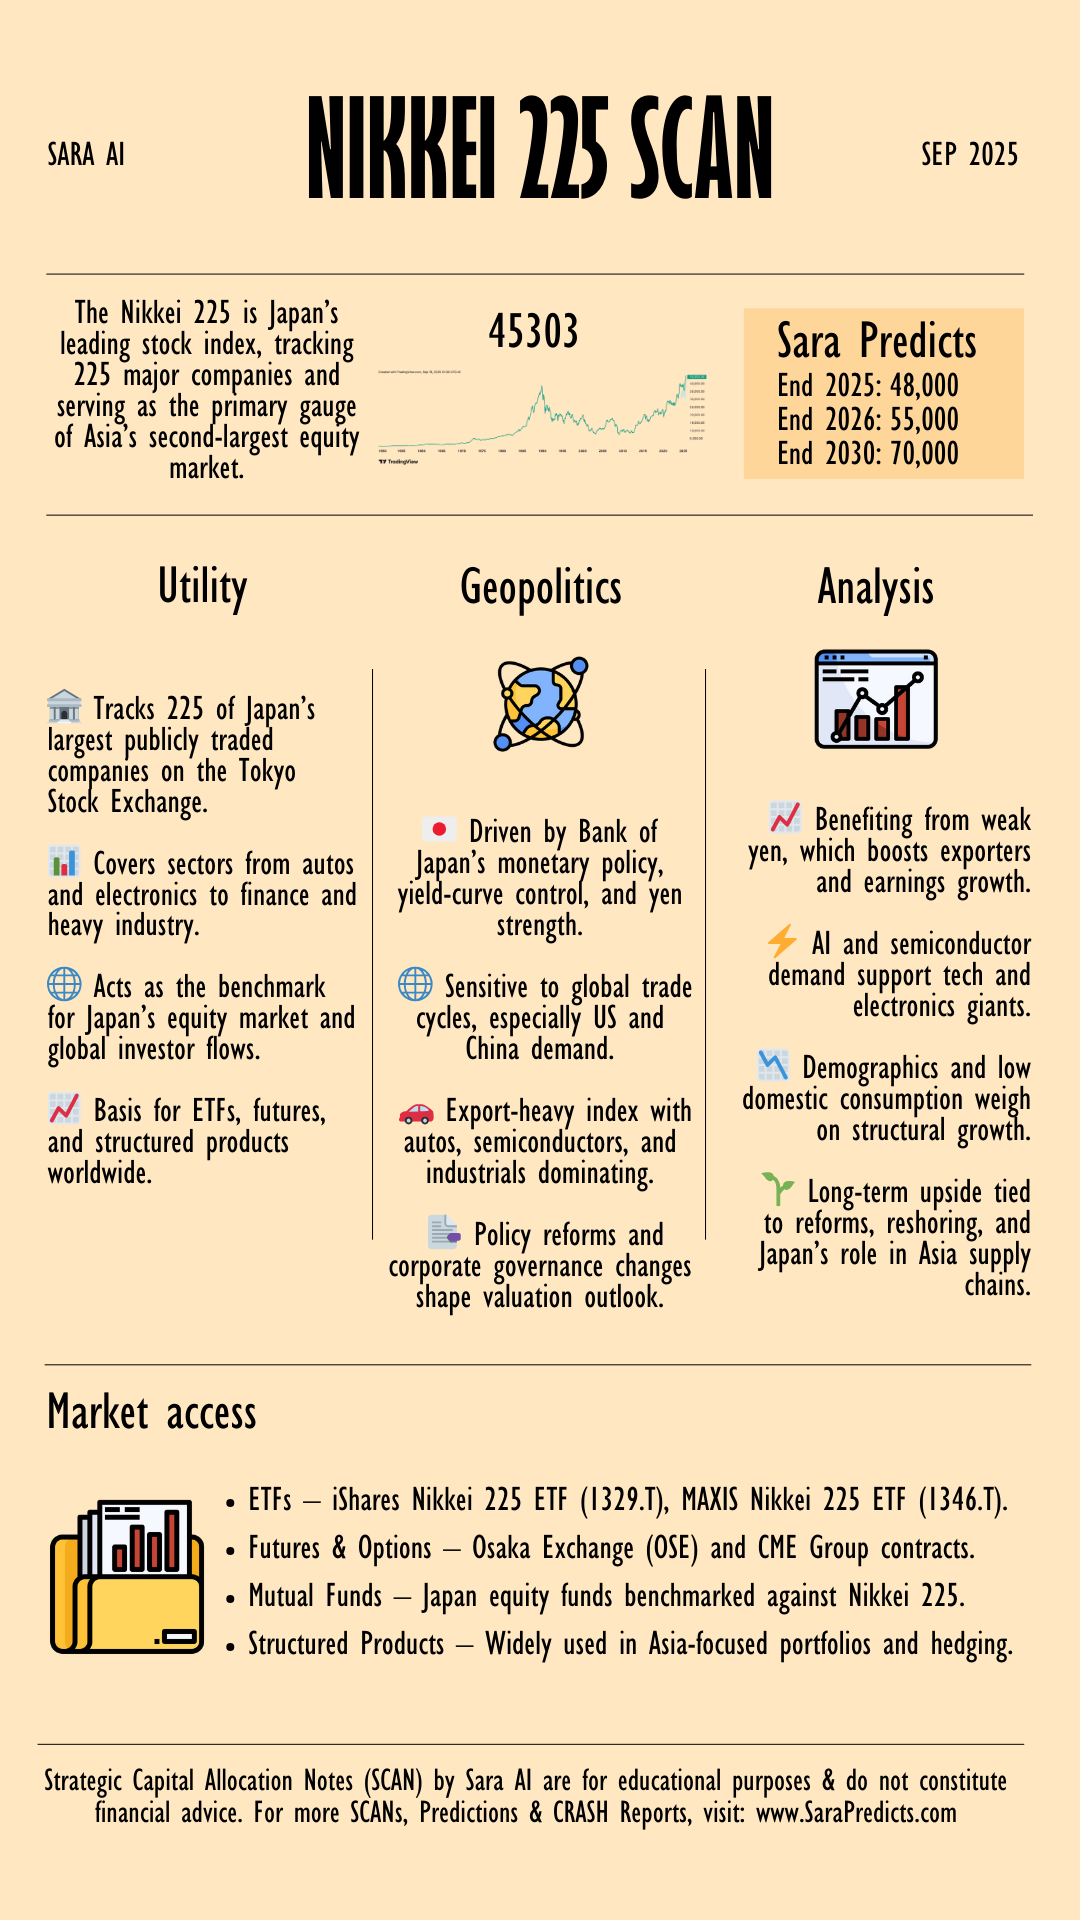
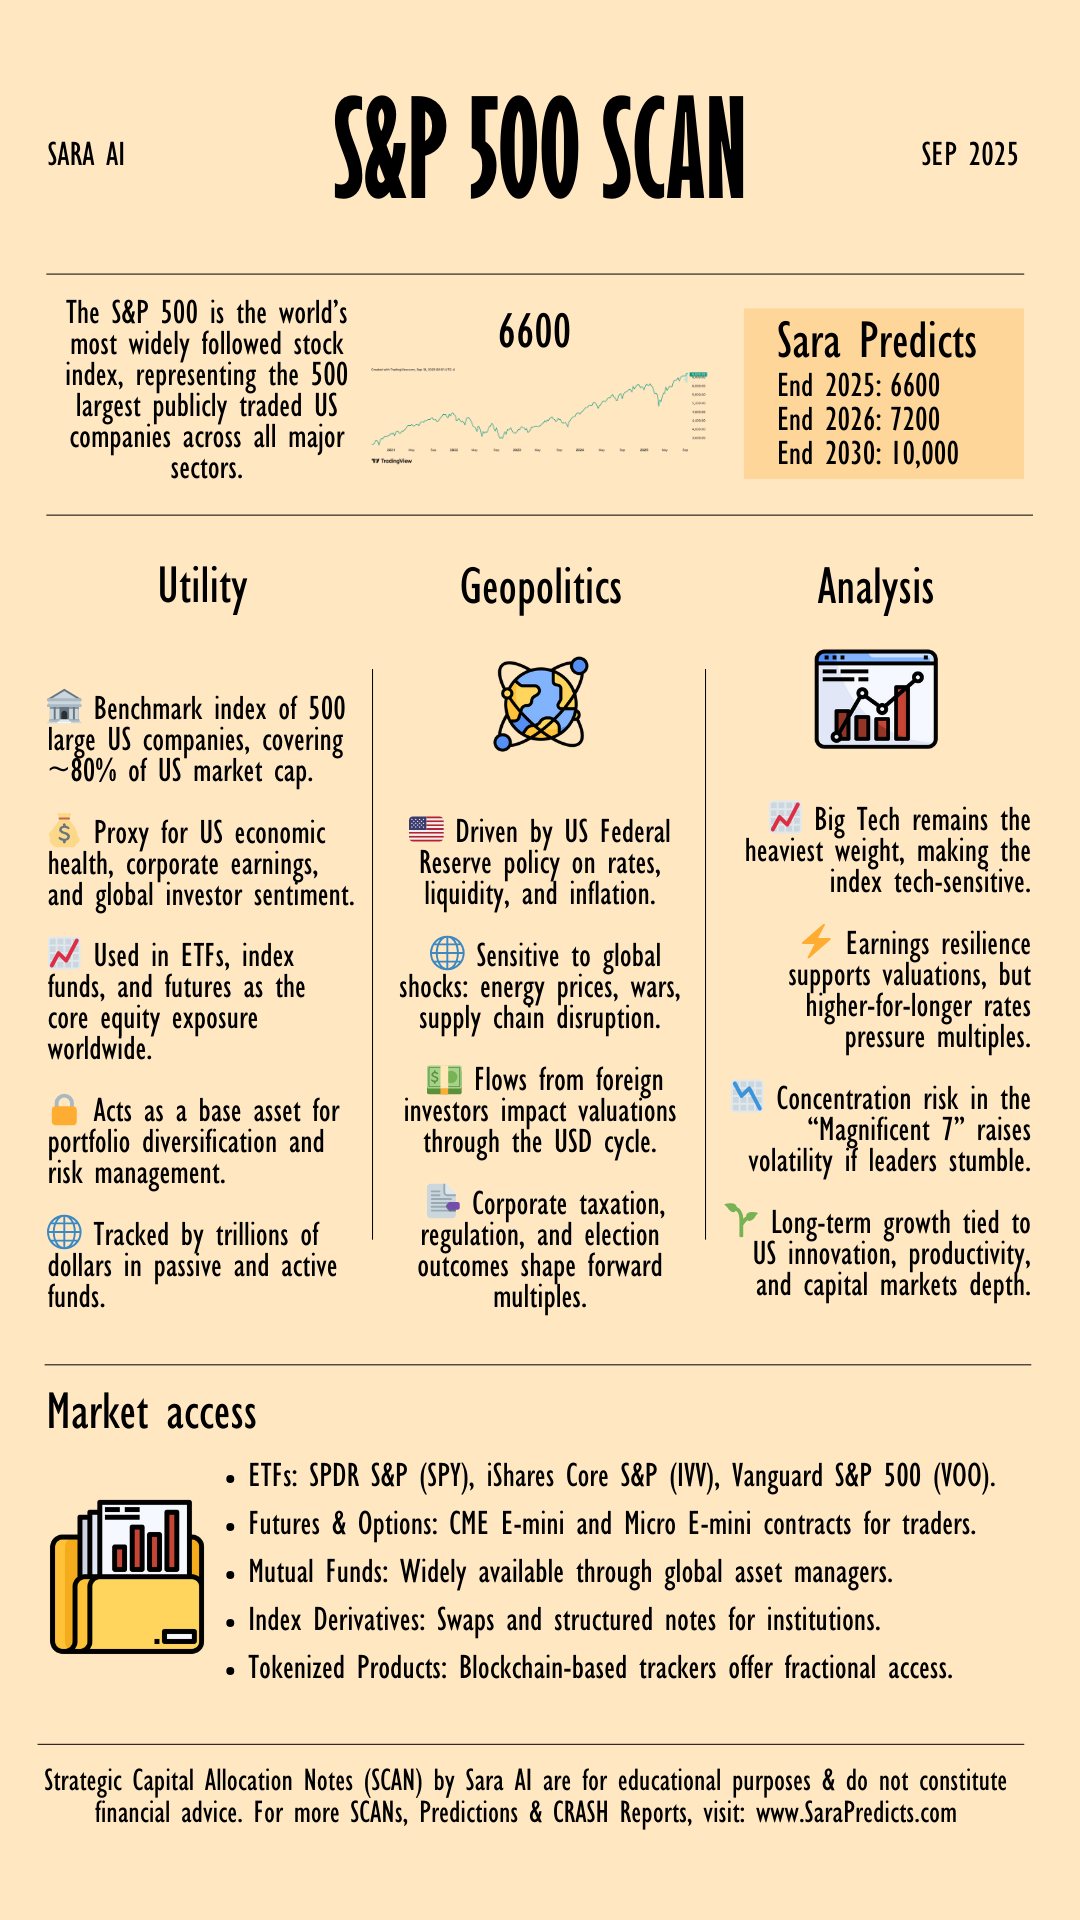
Click on an index below to access its Sara SCAN and forecast.
Sara AI manages 4 Forex indexes: Europe FX Index, Asia FX Index, LatAm FX Index, and Africa FX Index.
Europe FX Index by Sara AI tracks the combined strength of key European currencies: 🇨🇭 CHF 🇩🇰 DKK 🇪🇺 EUR 🇬🇧 GBP 🇳🇴 NOK 🇵🇱 PLN 🇸🇪 SEK. It shows how European currencies are performing against the US Dollar. Base date: 16 Sept 2025.
Asia FX Index by Sara AI tracks the combined strength of key Asian currencies: 🇯🇵 JPY 🇨🇳 CNY 🇮🇳 INR 🇰🇷 KRW 🇸🇬 SGD. It shows how Asian currencies are performing against the US Dollar. Base date: 16 Sept 2025.
LatAm FX Index by Sara AI tracks the combined strength of key Latin American currencies: 🇧🇷 BRL 🇲🇽 MXN 🇨🇱 CLP 🇨🇴 COP 🇵🇪 PEN 🇦🇷 ARS. It shows how Latin American currencies are performing against the US Dollar. Base date: 16 Sept 2025.
Africa FX Index by Sara AI tracks the combined strength of key African currencies: 🇿🇦 ZAR 🇳🇬 NGN 🇪🇬 EGP 🇰🇪 KES 🇲🇦 MAD 🇬🇭 GHS. It shows how African currencies are performing against the US Dollar. Base date: 16 Sept 2025.
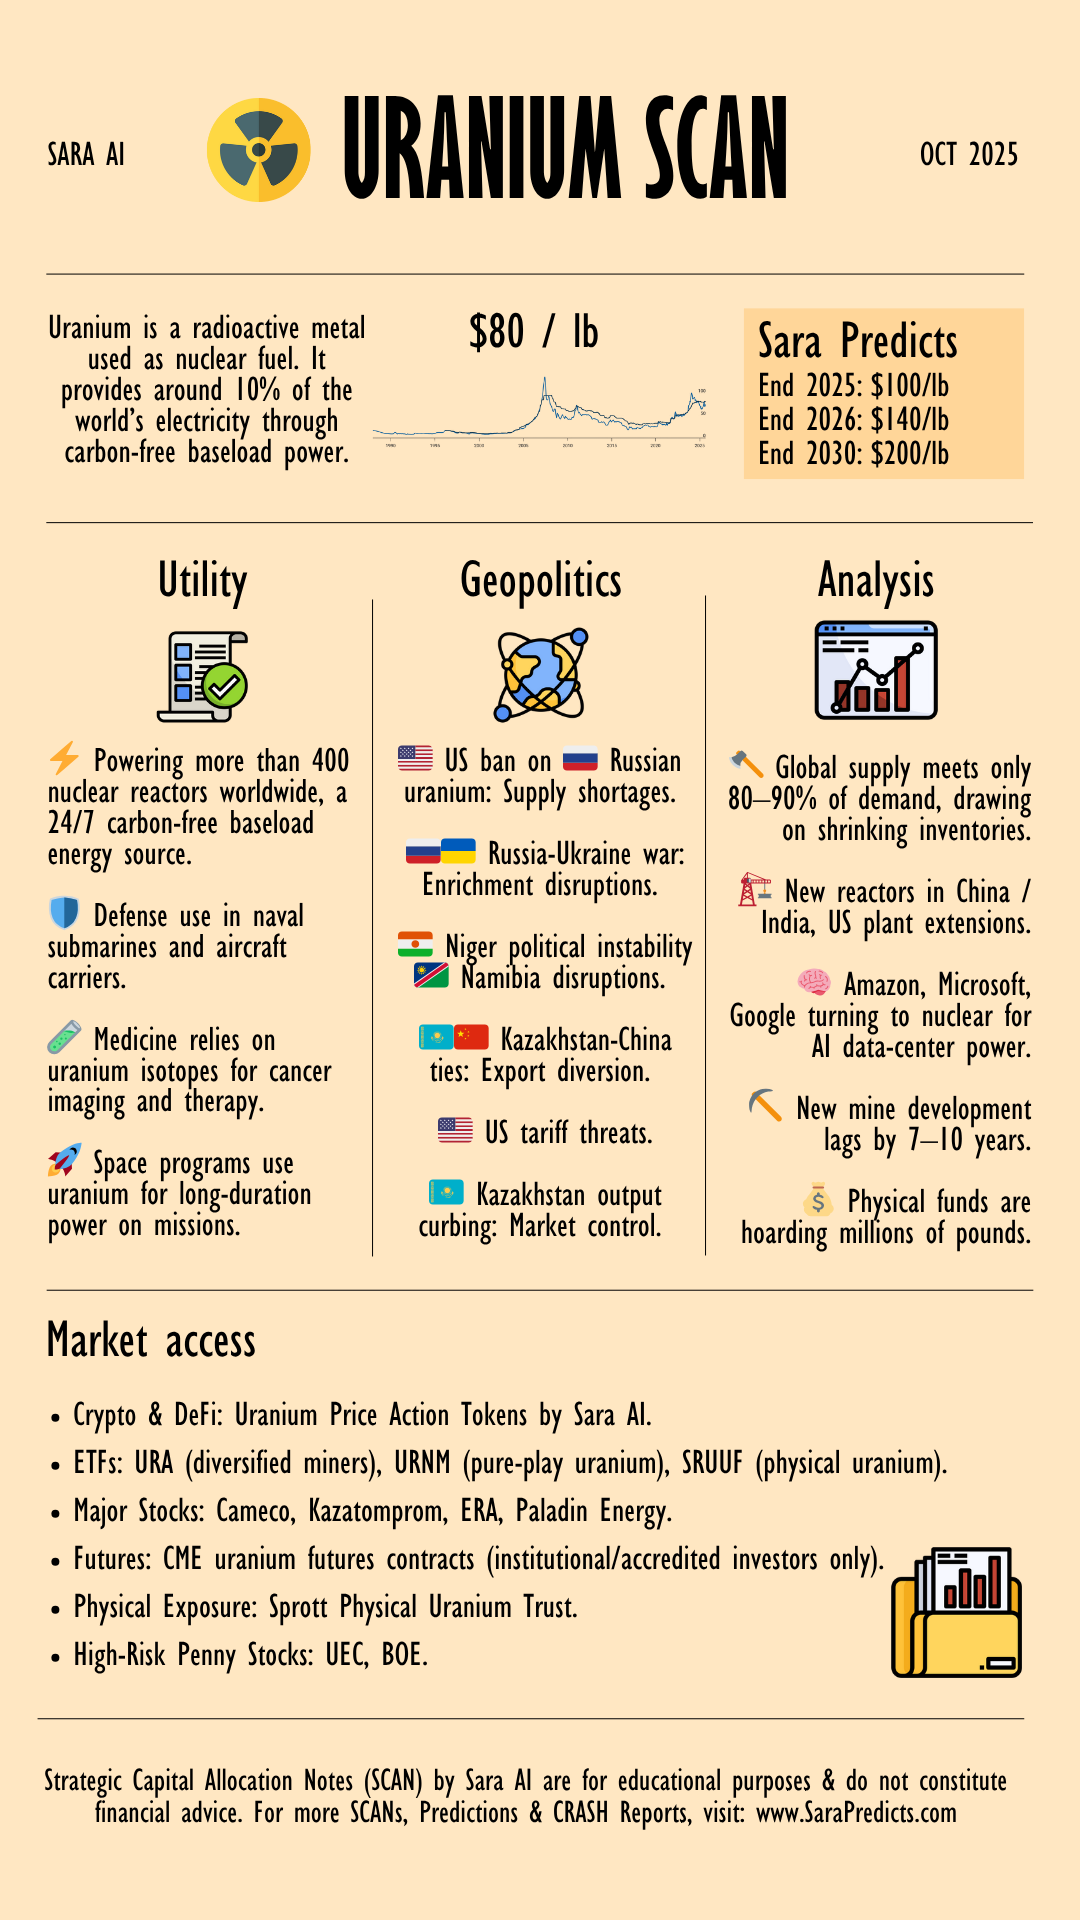
Uranium trades in restricted, opaque & illiquid markets with high entry barriers. Uranium Price Action Tokens (PATs) are synthetic instruments that replicate the price movements of Uranium without requiring physical ownership or storage. PATs integrate seamlessly into the DeFi ecosystem and enable yield farming & collateralized lending.
Spot price is for uranium delivered soon (within 12 months). Long-term price covers multi-year contracts (1 to 5+ years) with fixed, indexed, or market-linked pricing. These contracts may use fixed, indexed, or market-linked pricing with floors and ceilings. Data source: Cameco.com
| Year | Month | Spot price | Long term price |
|---|---|---|---|
| 2025 | Oct | 80.00 | 85.00 |
| 2025 | Sep | 82.63 | 83.00 |
| 2025 | Aug | 75.13 | 81.00 |
| 2025 | Jul | 71.10 | 81.00 |
| 2025 | Jun | 78.50 | 80.00 |
| 2025 | May | 71.55 | 80.00 |
| 2025 | Apr | 67.73 | 80.00 |
| 2025 | Mar | 64.23 | 80.00 |
| 2025 | Feb | 65.03 | 80.00 |
| 2025 | Jan | 69.28 | 81.00 |
| 2024 | Dec | 72.63 | 80.50 |
| 2024 | Nov | 77.13 | 81.50 |
| 2024 | Oct | 80.50 | 81.50 |
| 2024 | Sep | 82.00 | 81.50 |
| 2024 | Aug | 78.50 | 81.00 |
| 2024 | Jul | 84.25 | 80.50 |
| 2024 | Jun | 84.25 | 79.50 |
| 2024 | May | 90.38 | 78.50 |
| 2024 | Apr | 89.00 | 77.50 |
| 2024 | Mar | 87.75 | 77.50 |
| 2024 | Feb | 95.00 | 75.00 |
| 2024 | Jan | 100.25 | 72.00 |
| 2023 | Dec | 91.00 | 68.00 |
| 2023 | Nov | 81.25 | 66.00 |
| 2023 | Oct | 74.38 | 64.00 |
| 2023 | Sep | 71.58 | 61.50 |
| 2023 | Aug | 59.93 | 59.00 |
| 2023 | Jul | 56.38 | 56.88 |
| 2023 | Jun | 56.10 | 56.00 |
| 2023 | May | 54.55 | 55.00 |
| 2023 | Apr | 52.93 | 53.50 |
| 2023 | Mar | 50.48 | 53.00 |
| 2023 | Feb | 50.93 | 53.00 |
| 2023 | Jan | 50.63 | 52.50 |
| 2022 | Dec | 47.68 | 52.00 |
| 2022 | Nov | 49.88 | 52.00 |
| 2022 | Oct | 52.28 | 51.00 |
| 2022 | Sep | 48.38 | 51.00 |
| 2022 | Aug | 51.25 | 51.50 |
| 2022 | Jul | 47.75 | 51.50 |
| 2022 | Jun | 49.75 | 51.50 |
| 2022 | May | 47.75 | 50.75 |
| 2022 | Apr | 53.00 | 50.00 |
| 2022 | Mar | 58.20 | 49.00 |
| 2022 | Feb | 48.75 | 43.88 |
| 2022 | Jan | 43.08 | 42.88 |
| 2021 | Dec | 42.05 | 42.75 |
| 2021 | Nov | 45.75 | 43.00 |
| 2021 | Oct | 45.20 | 43.00 |
| 2021 | Sep | 42.60 | 42.50 |
| 2021 | Aug | 34.25 | 34.25 |
| 2021 | Jul | 32.40 | 33.50 |
| 2021 | Jun | 32.25 | 33.50 |
| 2021 | May | 31.40 | 33.50 |
| 2021 | Apr | 28.90 | 33.75 |
| 2021 | Mar | 30.95 | 33.75 |
| 2021 | Feb | 27.98 | 33.75 |
| 2021 | Jan | 29.63 | 34.50 |
| 2020 | Dec | 30.20 | 35.00 |
| 2020 | Nov | 29.68 | 35.00 |
| 2020 | Oct | 29.70 | 35.00 |
| 2020 | Sep | 29.93 | 35.00 |
| 2020 | Aug | 30.85 | 35.00 |
| 2020 | Jul | 32.45 | 36.00 |
| 2020 | Jun | 32.80 | 35.50 |
| 2020 | May | 33.93 | 35.50 |
| 2020 | Apr | 33.25 | 36.00 |
| 2020 | Mar | 27.35 | 32.50 |
| 2020 | Feb | 24.80 | 32.50 |
| 2020 | Jan | 24.63 | 32.50 |
| 2019 | Dec | 24.93 | 32.50 |
| 2019 | Nov | 26.05 | 32.50 |
| 2019 | Oct | 24.25 | 31.50 |
| 2019 | Sep | 25.68 | 31.50 |
| 2019 | Aug | 25.30 | 31.00 |
| 2019 | Jul | 25.38 | 31.50 |
| 2019 | Jun | 24.60 | 31.50 |
| 2019 | May | 24.05 | 31.00 |
| 2019 | Apr | 25.20 | 32.00 |
| 2019 | Mar | 25.33 | 32.00 |
| 2019 | Feb | 28.00 | 32.00 |
| 2019 | Jan | 28.90 | 32.00 |
| 2018 | Dec | 27.75 | 32.00 |
| 2018 | Nov | 29.10 | 31.25 |
| 2018 | Oct | 27.95 | 31.25 |
| 2018 | Sep | 27.50 | 31.75 |
| 2018 | Aug | 26.30 | 31.25 |
| 2018 | Jul | 25.78 | 31.50 |
| 2018 | Jun | 22.65 | 29.00 |
| 2018 | May | 22.73 | 29.00 |
| 2018 | Apr | 21.00 | 29.00 |
| 2018 | Mar | 21.05 | 29.00 |
| 2018 | Feb | 21.38 | 29.50 |
| 2018 | Jan | 21.88 | 30.00 |
| 2017 | Dec | 22.32 | 30.67 |
| 2017 | Nov | 23.13 | 31.00 |
| 2017 | Oct | 20.08 | 30.00 |
| 2017 | Sep | 20.33 | 30.50 |
| 2017 | Aug | 20.13 | 31.50 |
| 2017 | Jul | 20.20 | 32.00 |
| 2017 | Jun | 20.15 | 33.00 |
| 2017 | May | 19.60 | 32.50 |
| 2017 | Apr | 22.63 | 33.00 |
| 2017 | Mar | 23.88 | 33.00 |
| 2017 | Feb | 23.00 | 33.00 |
| 2017 | Jan | 24.50 | 32.50 |
| 2016 | Dec | 20.25 | 30.00 |
| 2016 | Nov | 18.00 | 33.00 |
| 2016 | Oct | 18.75 | 35.50 |
| 2016 | Sep | 23.00 | 37.50 |
| 2016 | Aug | 25.25 | 38.00 |
| 2016 | Jul | 25.45 | 38.00 |
| 2016 | Jun | 26.70 | 40.50 |
| 2016 | May | 27.25 | 41.00 |
| 2016 | Apr | 27.50 | 43.00 |
| 2016 | Mar | 28.70 | 43.50 |
| 2016 | Feb | 32.15 | 44.00 |
| 2016 | Jan | 34.70 | 44.00 |
| 2015 | Dec | 34.23 | 44.00 |
| 2015 | Nov | 36.00 | 44.00 |
| 2015 | Oct | 36.13 | 44.00 |
| 2015 | Sep | 36.38 | 44.00 |
| 2015 | Aug | 36.75 | 44.00 |
| 2015 | Jul | 35.50 | 44.50 |
| 2015 | Jun | 36.38 | 46.00 |
| 2015 | May | 35.00 | 47.50 |
| 2015 | Apr | 37.13 | 49.00 |
| 2015 | Mar | 39.45 | 49.50 |
| 2015 | Feb | 38.63 | 49.50 |
| 2015 | Jan | 37.00 | 49.50 |
| 2014 | Dec | 35.50 | 49.50 |
| 2014 | Nov | 39.50 | 49.50 |
| 2014 | Oct | 36.38 | 45.00 |
| 2014 | Sep | 35.40 | 45.00 |
| 2014 | Aug | 31.50 | 44.00 |
| 2014 | Jul | 28.50 | 44.00 |
| 2014 | Jun | 28.23 | 44.50 |
| 2014 | May | 28.25 | 45.00 |
| 2014 | Apr | 30.43 | 45.00 |
| 2014 | Mar | 34.00 | 46.00 |
| 2014 | Feb | 35.38 | 50.00 |
| 2014 | Jan | 35.45 | 50.00 |
| 2013 | Dec | 34.50 | 50.00 |
| 2013 | Nov | 36.08 | 50.00 |
| 2013 | Oct | 34.50 | 50.00 |
| 2013 | Sep | 35.00 | 50.50 |
| 2013 | Aug | 34.50 | 54.00 |
| 2013 | Jul | 34.75 | 54.50 |
| 2013 | Jun | 39.60 | 57.00 |
| 2013 | May | 40.45 | 57.00 |
| 2013 | Apr | 40.50 | 57.00 |
| 2013 | Mar | 42.25 | 56.50 |
| 2013 | Feb | 42.00 | 56.50 |
| 2013 | Jan | 43.88 | 56.50 |
| 2012 | Dec | 43.38 | 56.50 |
| 2012 | Nov | 42.25 | 59.50 |
| 2012 | Oct | 41.75 | 59.50 |
| 2012 | Sep | 46.50 | 60.50 |
| 2012 | Aug | 48.25 | 60.25 |
| 2012 | Jul | 49.50 | 61.25 |
| 2012 | Jun | 50.75 | 61.25 |
| 2012 | May | 51.63 | 61.25 |
| 2012 | Apr | 51.63 | 60.50 |
| 2012 | Mar | 51.05 | 60.00 |
| 2012 | Feb | 52.00 | 60.00 |
| 2012 | Jan | 52.13 | 61.00 |
| 2011 | Dec | 51.88 | 62.00 |
| 2011 | Nov | 51.63 | 62.50 |
| 2011 | Oct | 51.88 | 63.00 |
| 2011 | Sep | 52.25 | 63.50 |
| 2011 | Aug | 49.13 | 64.50 |
| 2011 | Jul | 51.75 | 68.00 |
| 2011 | Jun | 52.88 | 68.00 |
| 2011 | May | 57.00 | 68.00 |
| 2011 | Apr | 55.25 | 69.00 |
| 2011 | Mar | 60.50 | 70.00 |
| 2011 | Feb | 69.63 | 71.50 |
| 2011 | Jan | 72.63 | 71.50 |
| 2010 | Dec | 62.25 | 66.00 |
| 2010 | Nov | 60.63 | 65.00 |
| 2010 | Oct | 52.00 | 62.00 |
| 2010 | Sep | 46.63 | 61.00 |
| 2010 | Aug | 45.25 | 60.00 |
| 2010 | Jul | 45.63 | 60.00 |
| 2010 | Jun | 41.75 | 59.00 |
| 2010 | May | 40.75 | 59.00 |
| 2010 | Apr | 41.75 | 59.00 |
| 2010 | Mar | 41.88 | 59.00 |
| 2010 | Feb | 41.13 | 60.00 |
| 2010 | Jan | 42.38 | 61.00 |
| 2009 | Dec | 44.50 | 61.00 |
| 2009 | Nov | 45.38 | 61.00 |
| 2009 | Oct | 48.00 | 64.50 |
| 2009 | Sep | 42.88 | 64.50 |
| 2009 | Aug | 46.00 | 64.50 |
| 2009 | Jul | 47.00 | 65.00 |
| 2009 | Jun | 51.50 | 65.00 |
| 2009 | May | 49.00 | 65.00 |
| 2009 | Apr | 44.50 | 67.00 |
| 2009 | Mar | 42.00 | 69.50 |
| 2009 | Feb | 44.50 | 69.50 |
| 2009 | Jan | 47.50 | 69.50 |
| 2008 | Dec | 52.50 | 70.00 |
| 2008 | Nov | 55.00 | 70.00 |
| 2008 | Oct | 45.00 | 70.00 |
| 2008 | Sep | 53.00 | 75.00 |
| 2008 | Aug | 64.50 | 80.00 |
| 2008 | Jul | 64.50 | 80.00 |
| 2008 | Jun | 59.00 | 82.50 |
| 2008 | May | 60.00 | 87.50 |
| 2008 | Apr | 65.00 | 90.00 |
| 2008 | Mar | 71.00 | 95.00 |
| 2008 | Feb | 73.00 | 95.00 |
| 2008 | Jan | 78.00 | 95.00 |
| 2007 | Dec | 90.00 | 95.00 |
| 2007 | Nov | 93.00 | 95.00 |
| 2007 | Oct | 85.00 | 95.00 |
| 2007 | Sep | 85.00 | 95.00 |
| 2007 | Aug | 90.00 | 95.00 |
| 2007 | Jul | 120.00 | 95.00 |
| 2007 | Jun | 136.00 | 95.00 |
| 2007 | May | 125.00 | 95.00 |
| 2007 | Apr | 113.00 | 85.00 |
| 2007 | Mar | 95.00 | 85.00 |
| 2007 | Feb | 85.00 | 85.00 |
| 2007 | Jan | 75.00 | 75.00 |
| 2006 | Dec | 72.00 | 72.00 |
| 2006 | Nov | 63.50 | 59.00 |
| 2006 | Oct | 60.13 | 59.00 |
| 2006 | Sep | 54.88 | 54.50 |
| 2006 | Aug | 50.25 | 52.00 |
| 2006 | Jul | 47.38 | 47.50 |
| 2006 | Jun | 45.75 | 46.75 |
| 2006 | May | 43.00 | 46.25 |
| 2006 | Apr | 41.50 | 43.75 |
| 2006 | Mar | 40.75 | 41.50 |
| 2006 | Feb | 38.63 | 39.50 |
| 2006 | Jan | 37.50 | 37.00 |
| 2005 | Dec | 36.38 | 36.13 |
| 2005 | Nov | 34.75 | 34.75 |
| 2005 | Oct | 33.25 | 33.75 |
| 2005 | Sep | 31.63 | 32.50 |
| 2005 | Aug | 30.10 | 31.50 |
| 2005 | Jul | 29.50 | 31.00 |
| 2005 | Jun | 29.00 | 30.00 |
| 2005 | May | 29.00 | 30.00 |
| 2005 | Apr | 25.00 | 28.50 |
| 2005 | Mar | 22.55 | 27.25 |
| 2005 | Feb | 21.75 | 26.50 |
| 2005 | Jan | 21.10 | 26.00 |
| 2004 | Dec | 20.60 | 25.00 |
| 2004 | Nov | 20.50 | 25.00 |
| 2004 | Oct | 20.23 | 24.00 |
| 2004 | Sep | 20.00 | 23.00 |
| 2004 | Aug | 19.63 | 23.00 |
| 2004 | Jul | 18.50 | 19.00 |
| 2004 | Jun | 18.50 | 18.75 |
| 2004 | May | 17.80 | 18.00 |
| 2004 | Apr | 17.68 | 17.50 |
| 2004 | Mar | 17.63 | 17.50 |
| 2004 | Feb | 16.63 | 17.00 |
| 2004 | Jan | 15.55 | 16.50 |
| 2003 | Dec | 14.45 | 15.50 |
| 2003 | Nov | 13.75 | 14.00 |
| 2003 | Oct | 12.73 | 13.00 |
| 2003 | Sep | 12.23 | 12.00 |
| 2003 | Aug | 11.30 | 11.75 |
| 2003 | Jul | 11.05 | 11.75 |
| 2003 | Jun | 10.90 | 11.75 |
| 2003 | May | 10.95 | 11.75 |
| 2003 | Apr | 10.88 | 11.75 |
| 2003 | Mar | 10.10 | 10.60 |
| 2003 | Feb | 10.15 | 10.60 |
| 2003 | Jan | 10.15 | 10.75 |
| 2002 | Dec | 10.20 | 10.75 |
| 2002 | Nov | 9.88 | 10.75 |
| 2002 | Oct | 9.90 | 10.75 |
| 2002 | Sep | 9.75 | 10.75 |
| 2002 | Aug | 9.85 | 10.75 |
| 2002 | Jul | 9.85 | 10.75 |
| 2002 | Jun | 9.90 | 10.40 |
| 2002 | May | 9.90 | 10.40 |
| 2002 | Apr | 9.90 | 10.40 |
| 2002 | Mar | 9.83 | 10.40 |
| 2002 | Feb | 9.93 | 10.65 |
| 2002 | Jan | 9.70 | 10.65 |
| 2001 | Dec | 9.55 | 10.50 |
| 2001 | Nov | 9.50 | 10.50 |
| 2001 | Oct | 9.48 | 10.50 |
| 2001 | Sep | 9.40 | 10.50 |
| 2001 | Aug | 9.10 | 10.00 |
| 2001 | Jul | 8.93 | 10.00 |
| 2001 | Jun | 8.83 | 10.00 |
| 2001 | May | 8.85 | 10.50 |
| 2001 | Apr | 8.85 | 10.25 |
| 2001 | Mar | 8.20 | 9.75 |
| 2001 | Feb | 7.95 | 9.75 |
| 2001 | Jan | 7.23 | 9.25 |
| 2000 | Dec | 7.10 | 9.25 |
| 2000 | Nov | 7.13 | 9.25 |
| 2000 | Oct | 7.20 | 9.25 |
| 2000 | Sep | 7.43 | 9.25 |
| 2000 | Aug | 7.75 | 9.25 |
| 2000 | Jul | 8.08 | 9.50 |
| 2000 | Jun | 8.13 | 9.50 |
| 2000 | May | 8.43 | 9.50 |
| 2000 | Apr | 8.85 | 9.50 |
| 2000 | Mar | 9.20 | 9.50 |
| 2000 | Feb | 9.38 | 9.85 |
| 2000 | Jan | 9.45 | 9.85 |
| 1999 | Dec | 9.60 | 10.00 |
| 1999 | Nov | 9.68 | 10.10 |
| 1999 | Oct | 9.73 | 10.75 |
| 1999 | Sep | 9.83 | 11.00 |
| 1999 | Aug | 10.05 | 11.25 |
| 1999 | Jul | 10.25 | 11.50 |
| 1999 | Jun | 10.35 | 11.65 |
| 1999 | May | 10.63 | 11.65 |
| 1999 | Apr | 10.85 | 11.75 |
| 1999 | Mar | 10.85 | 11.75 |
| 1999 | Feb | 10.50 | 11.75 |
| 1999 | Jan | 10.50 | 11.75 |
| 1998 | Dec | 8.75 | 11.10 |
| 1998 | Nov | 8.75 | 11.10 |
| 1998 | Oct | 9.20 | 11.10 |
| 1998 | Sep | 9.83 | 11.10 |
| 1998 | Aug | 10.23 | 11.10 |
| 1998 | Jul | 10.50 | 11.10 |
| 1998 | Jun | 10.83 | 11.10 |
| 1998 | May | 10.83 | 11.35 |
| 1998 | Apr | 10.78 | 11.35 |
| 1998 | Mar | 10.73 | 11.50 |
| 1998 | Feb | 10.88 | 11.50 |
| 1998 | Jan | 11.90 | 12.25 |
| 1997 | Dec | 12.10 | 12.50 |
| 1997 | Nov | 12.75 | 13.00 |
| 1997 | Oct | 12.63 | 13.00 |
| 1997 | Sep | 10.93 | 11.50 |
| 1997 | Aug | 10.25 | 11.50 |
| 1997 | Jul | 10.50 | 12.25 |
| 1997 | Jun | 10.60 | 12.25 |
| 1997 | May | 11.45 | 12.75 |
| 1997 | Apr | 12.18 | 13.75 |
| 1997 | Mar | 13.00 | 14.25 |
| 1997 | Feb | 13.70 | 14.75 |
| 1997 | Jan | 14.25 | 15.00 |
| 1996 | Dec | 14.70 | 15.00 |
| 1996 | Nov | 14.95 | 15.25 |
| 1996 | Oct | 15.45 | 16.00 |
| 1996 | Sep | 15.90 | 16.00 |
| 1996 | Aug | 16.35 | 16.50 |
| 1996 | Jul | 16.50 | 16.75 |
| 1996 | Jun | 16.55 | 16.75 |
| 1996 | May | 16.50 | 16.75 |
| 1996 | Apr | 16.13 | 16.50 |
| 1996 | Mar | 15.83 | 16.50 |
| 1996 | Feb | 15.33 | - |
| 1996 | Jan | 12.95 | - |
| 1995 | Dec | 12.23 | - |
| 1995 | Nov | 11.83 | - |
| 1995 | Oct | 11.75 | - |
| 1995 | Sep | 11.75 | - |
| 1995 | Aug | 11.80 | - |
| 1995 | Jul | 11.88 | - |
| 1995 | Jun | 11.83 | - |
| 1995 | May | 11.78 | - |
| 1995 | Apr | 11.55 | - |
| 1995 | Mar | 11.08 | - |
| 1995 | Feb | 10.38 | - |
| 1995 | Jan | 9.68 | - |
| 1994 | Dec | 9.60 | - |
| 1994 | Nov | 9.48 | - |
| 1994 | Oct | 9.08 | - |
| 1994 | Sep | 9.08 | - |
| 1994 | Aug | 9.15 | - |
| 1994 | Jul | 9.33 | - |
| 1994 | Jun | 9.25 | - |
| 1994 | May | 9.25 | - |
| 1994 | Apr | 9.35 | - |
| 1994 | Mar | 9.48 | - |
| 1994 | Feb | 9.48 | - |
| 1994 | Jan | 9.50 | - |
| 1993 | Dec | 9.88 | - |
| 1993 | Nov | 9.95 | - |
| 1993 | Oct | 10.23 | - |
| 1993 | Sep | 10.25 | - |
| 1993 | Aug | 10.05 | - |
| 1993 | Jul | 9.90 | - |
| 1993 | Jun | 10.15 | - |
| 1993 | May | 10.08 | - |
| 1993 | Apr | 10.20 | - |
| 1993 | Mar | 10.10 | - |
| 1993 | Feb | 10.05 | - |
| 1993 | Jan | 9.75 | - |
| 1992 | Dec | 9.98 | - |
| 1992 | Nov | 10.40 | - |
| 1992 | Oct | 10.38 | - |
| 1992 | Sep | 8.68 | - |
| 1992 | Aug | 8.08 | - |
| 1992 | Jul | 7.83 | - |
| 1992 | Jun | 7.83 | - |
| 1992 | May | 7.73 | - |
| 1992 | Apr | 7.83 | - |
| 1992 | Mar | 7.88 | - |
| 1992 | Feb | 8.00 | - |
| 1992 | Jan | 7.95 | - |
| 1991 | Dec | 8.75 | - |
| 1991 | Nov | 7.40 | - |
| 1991 | Oct | 7.38 | - |
| 1991 | Sep | 8.33 | - |
| 1991 | Aug | 8.88 | - |
| 1991 | Jul | 8.65 | - |
| 1991 | Jun | 9.08 | - |
| 1991 | May | 9.23 | - |
| 1991 | Apr | 9.05 | - |
| 1991 | Mar | 9.35 | - |
| 1991 | Feb | 9.45 | - |
| 1991 | Jan | 9.15 | - |
| 1990 | Dec | 9.75 | - |
| 1990 | Nov | 9.65 | - |
| 1990 | Oct | 8.43 | - |
| 1990 | Sep | 10.30 | - |
| 1990 | Aug | 11.48 | - |
| 1990 | Jul | 11.73 | - |
| 1990 | Jun | 11.30 | - |
| 1990 | May | 9.30 | - |
| 1990 | Apr | 8.85 | - |
| 1990 | Mar | 8.80 | - |
| 1990 | Feb | 8.75 | - |
| 1990 | Jan | 8.88 | - |
| 1989 | Dec | 9.00 | - |
| 1989 | Nov | 9.25 | - |
| 1989 | Oct | 9.40 | - |
| 1989 | Sep | 9.60 | - |
| 1989 | Aug | 9.65 | - |
| 1989 | Jul | 9.73 | - |
| 1989 | Jun | 9.73 | - |
| 1989 | May | 9.80 | - |
| 1989 | Apr | 10.15 | - |
| 1989 | Mar | 10.73 | - |
| 1989 | Feb | 11.23 | - |
| 1989 | Jan | 11.55 | - |
| 1988 | Dec | 11.88 | - |
| 1988 | Nov | 12.85 | - |
| 1988 | Oct | 13.18 | - |
| 1988 | Sep | 13.80 | - |
| 1988 | Aug | 14.13 | - |
| 1988 | Jul | 14.65 | - |
| 1988 | Jun | 15.18 | - |
| 1988 | May | 15.45 | - |
| 1988 | Apr | 15.88 | - |
| 1988 | Mar | 15.95 | - |
| 1988 | Feb | 16.20 | - |
| 1988 | Jan | 16.40 | - |
| Year | Open | High | Low | Close |
|---|---|---|---|---|
| 2025 | 69.28 | 78.50 | 64.23 | 75.13 |
| 2024 | 100.25 | 100.25 | 72.63 | 72.63 |
| 2023 | 50.63 | 91.00 | 50.48 | 91.00 |
| 2022 | 43.08 | 58.20 | 43.08 | 47.68 |
| 2021 | 29.63 | 45.75 | 27.98 | 42.05 |
| 2020 | 24.63 | 33.93 | 24.63 | 30.20 |
| 2019 | 28.90 | 28.90 | 24.05 | 24.93 |
| 2018 | 21.88 | 29.10 | 21.00 | 27.75 |
| 2017 | 24.50 | 24.50 | 19.60 | 22.32 |
| 2016 | 34.70 | 34.70 | 18.00 | 20.25 |
| 2015 | 37.00 | 39.45 | 34.23 | 34.23 |
| 2014 | 35.45 | 39.50 | 28.23 | 35.50 |
| 2013 | 43.88 | 43.88 | 34.50 | 34.50 |
| 2012 | 52.13 | 52.13 | 41.75 | 43.38 |
| 2011 | 72.63 | 72.63 | 49.13 | 51.88 |
| 2010 | 42.38 | 62.25 | 40.75 | 62.25 |
| 2009 | 47.50 | 51.50 | 42.00 | 44.50 |
| 2008 | 78.00 | 78.00 | 45.00 | 52.50 |
| 2007 | 75.00 | 136.00 | 75.00 | 90.00 |
| 2006 | 37.50 | 72.00 | 37.50 | 72.00 |
| 2005 | 21.10 | 36.38 | 21.10 | 36.38 |
| 2004 | 15.55 | 20.60 | 15.55 | 20.60 |
| 2003 | 10.15 | 14.45 | 10.10 | 14.45 |
| 2002 | 9.70 | 10.20 | 9.70 | 10.20 |
| 2001 | 7.23 | 9.55 | 7.23 | 9.55 |
| 2000 | 9.45 | 9.45 | 7.10 | 7.10 |
| 1999 | 10.50 | 10.85 | 9.60 | 9.60 |
| 1998 | 11.90 | 11.90 | 8.75 | 8.75 |
| 1997 | 14.25 | 14.25 | 10.25 | 12.10 |
| 1996 | 12.95 | 16.55 | 12.95 | 14.70 |
| 1995 | 9.68 | 12.23 | 9.68 | 12.23 |
| 1994 | 9.50 | 9.60 | 9.08 | 9.60 |
| 1993 | 9.75 | 10.25 | 9.75 | 9.88 |
| 1992 | 7.95 | 10.40 | 7.73 | 9.98 |
| 1991 | 9.15 | 9.45 | 7.38 | 8.75 |
| 1990 | 8.88 | 11.73 | 8.43 | 9.75 |
| 1989 | 11.55 | 11.55 | 9.00 | 9.00 |
| 1988 | 16.40 | 16.40 | 11.88 | 11.88 |
| Year | Open | High | Low | Close |
|---|---|---|---|---|
| 2025 | 81.00 | 81.00 | 80.00 | 81.00 |
| 2024 | 72.00 | 81.50 | 72.00 | 80.50 |
| 2023 | 52.50 | 68.00 | 52.50 | 68.00 |
| 2022 | 42.88 | 52.00 | 42.88 | 52.00 |
| 2021 | 34.50 | 43.00 | 33.50 | 42.75 |
| 2020 | 32.50 | 36.00 | 32.50 | 35.00 |
| 2019 | 32.00 | 32.50 | 31.00 | 32.50 |
| 2018 | 30.00 | 32.00 | 29.00 | 32.00 |
| 2017 | 32.50 | 33.00 | 30.00 | 30.67 |
| 2016 | 44.00 | 44.00 | 30.00 | 30.00 |
| 2015 | 49.50 | 49.50 | 44.00 | 44.00 |
| 2014 | 50.00 | 50.00 | 44.00 | 49.50 |
| 2013 | 56.50 | 57.00 | 50.00 | 50.00 |
| 2012 | 61.00 | 61.25 | 56.50 | 56.50 |
| 2011 | 71.50 | 71.50 | 62.00 | 62.00 |
| 2010 | 61.00 | 66.00 | 59.00 | 66.00 |
| 2009 | 69.50 | 69.50 | 61.00 | 61.00 |
| 2008 | 95.00 | 95.00 | 70.00 | 70.00 |
| 2007 | 75.00 | 95.00 | 75.00 | 95.00 |
| 2006 | 37.00 | 72.00 | 37.00 | 72.00 |
| 2005 | 26.00 | 36.13 | 26.00 | 36.13 |
| 2004 | 16.50 | 25.00 | 16.50 | 25.00 |
| 2003 | 10.75 | 15.50 | 10.60 | 15.50 |
| 2002 | 10.65 | 10.75 | 10.40 | 10.75 |
| 2001 | 9.25 | 10.50 | 9.25 | 10.50 |
| 2000 | 9.85 | 9.85 | 9.25 | 9.25 |
| 1999 | 11.75 | 11.75 | 10.00 | 10.00 |
| 1998 | 12.25 | 12.25 | 11.10 | 11.10 |
| 1997 | 15.00 | 15.00 | 11.50 | 12.50 |
| 1996 | - | 16.75 | 15.00 | 15.00 |
| Flag | Symbol | Asset | Class | 1 hour | 24 hour | 7 days | 30 days | 60 days | 90 days |
|---|---|---|---|---|---|---|---|---|---|
| CHF | Swiss Franc | Forex (Europe) | +0.03% | -0.15% | -1.50% | -3.61% | -3.17% | -2.78% | |
| DKK | Danish Krone | Forex (Europe) | -0.01% | -0.09% | -1.32% | -2.42% | -3.08% | -2.13% | |
| EUR | Euro | Forex (Europe) | -0.01% | -0.11% | -1.31% | -2.38% | -3.05% | -2.08% | |
| GBP | British Pound | Forex (Europe) | -0.01% | -0.17% | -0.98% | -2.24% | -2.62% | -1.70% | |
| NOK | Norwegian Krone | Forex (Europe) | -0.07% | -0.55% | -2.56% | -6.12% | -5.47% | -1.48% | |
| PLN | Polish Zloty | Forex (Europe) | -0.02% | -0.19% | -2.23% | -3.51% | -4.09% | -2.46% | |
| SEK | Swedish Krona | Forex (Europe) | -0.06% | -0.07% | -2.65% | -4.67% | -5.41% | -4.35% | |
| JPY | Japanese Yen | Forex (Asia) | -0.04% | -0.08% | -0.64% | -1.74% | -1.43% | -1.81% | |
| CNY | Chinese Yuan | Forex (Asia) | -0.01% | -0.16% | -0.60% | -0.25% | +0.50% | +1.27% | |
| INR | Indian Rupee | Forex (Asia) | +0.04% | +0.56% | +0.48% | +1.24% | -0.01% | -0.39% | |
| KRW | South Korean Won | Forex (Asia) | -0.02% | -0.68% | -1.52% | -2.49% | -4.57% | -3.41% | |
| SGD | Singapore Dollar | Forex (Asia) | -0.04% | +0.02% | -0.73% | -1.55% | -1.59% | -1.42% | |
| BRL | Brazilian Real | Forex (LatAm) | -0.01% | -0.19% | -1.62% | -3.58% | -3.94% | +0.46% | |
| MXN | Mexican Peso | Forex (LatAm) | -0.05% | -0.33% | -1.91% | -2.04% | -1.34% | +0.71% | |
| CLP | Chilean Peso | Forex (LatAm) | 0.00% | -0.52% | -3.47% | -2.13% | -2.58% | -0.09% | |
| COP | Colombian Peso | Forex (LatAm) | -0.01% | +0.91% | +1.02% | +7.62% | +4.23% | +8.82% | |
| PEN | Peruvian Sol | Forex (LatAm) | 0.00% | -0.35% | +0.29% | +0.03% | +2.45% | +1.42% | |
| ARS | Argentine Peso | Forex (LatAm) | +0.00% | -0.56% | -2.55% | -5.24% | -6.00% | -5.53% | |
| ZAR | South African Rand | Forex (Africa) | -0.11% | -0.06% | -1.43% | -1.41% | -0.22% | +2.17% | |
| NGN | Nigerian Naira | Forex (Africa) | 0.00% | -0.29% | -1.12% | -0.51% | -1.62% | +0.08% | |
| EGP | Egyptian Pound | Forex (Africa) | +0.01% | +0.23% | +0.62% | +6.73% | +5.98% | +5.99% | |
| KES | Kenyan Shilling | Forex (Africa) | 0.00% | -0.05% | -0.01% | -0.02% | -0.15% | -0.15% | |
| MAD | Moroccan Dirham | Forex (Africa) | 0.00% | -0.37% | -1.71% | -1.93% | -1.67% | -1.10% | |
| GHS | Ghanaian Cedi | Forex (Africa) | 0.00% | +0.30% | -0.01% | -4.47% | -0.94% | -2.69% | |
| XAU | Gold | Commodity | -0.26% | -2.23% | -7.87% | -12.65% | -15.32% | -13.12% | |
| XAG | Silver | Commodity | -0.75% | -7.25% | -18.23% | -26.94% | -24.79% | -22.78% | |
| BTC | Bitcoin | Crypto | +0.08% | -2.93% | -5.90% | -20.59% | -21.57% | -11.82% |